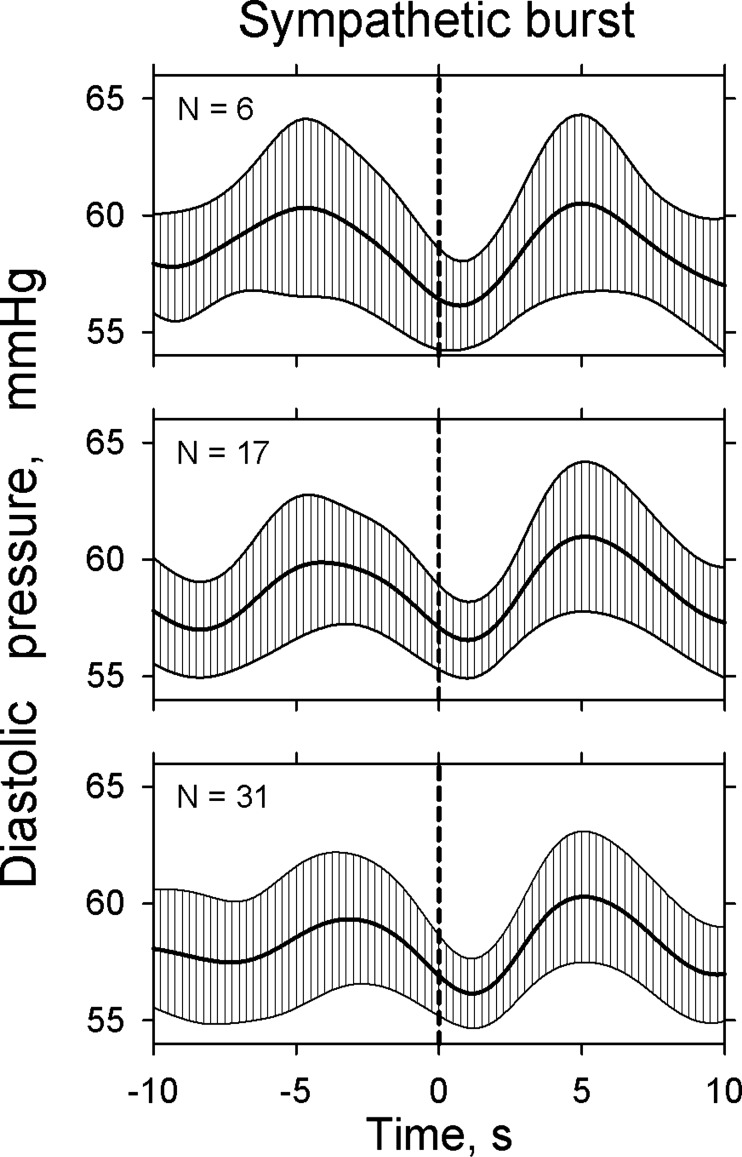
Fig. 2.

Average (±SE) diastolic pressure, signal-averaged on the leading edge of sympathetic bursts, from another subject. The three panels show analyses of bursts separated by 10 s (top), 8 s (middle), and 6 s (bottom). For the purposes of our study, we chose bursts separated by 6-s burst-free periods and considered these to be “isolated.” This compromise was necessary because very few subjects have muscle sympathetic burst frequencies <10/min.
