
Fig. 4.
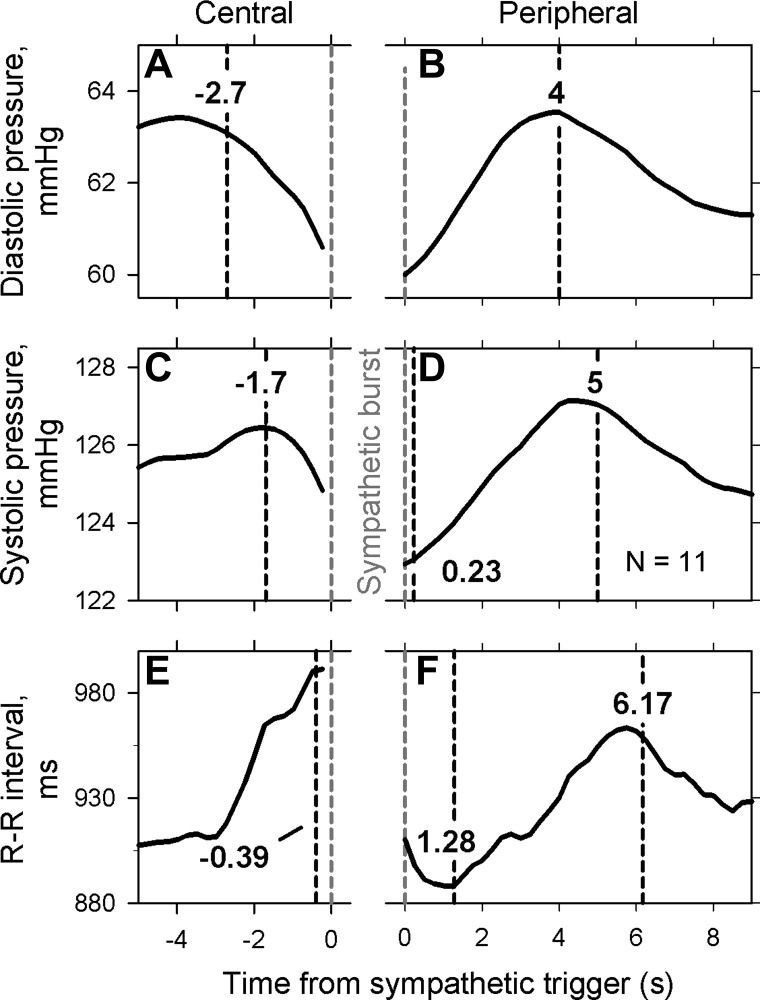
Average signals triggered on sympathetic bursts for all subjects. For measurements shown on left, muscle sympathetic nerve activity was advanced by each subject's measured latency to account for peripheral conduction delays. For measurements shown on the right, the timing of sympathetic nerve activity was not changed (see methods). The beginning of sympathetic bursts is indicated by the vertical dashed gray lines. Latencies, calculated with bending point analyses, are indicated in the vertical dashed black lines.