
Fig. 5.
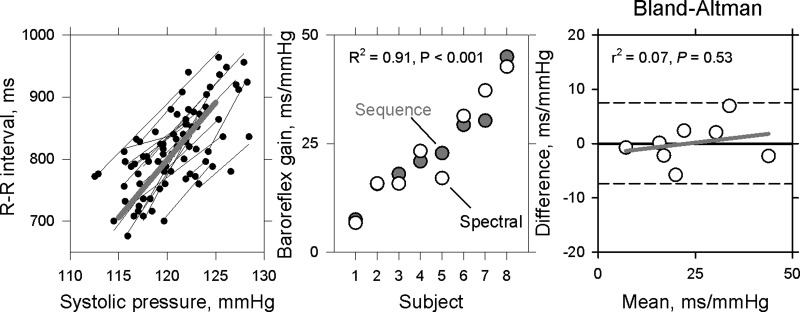
Average spontaneous baroreflex estimates from the eight subjects who had at least three acceptable systolic pressure-R-R interval ramps. Regressions of R-R intervals on systolic pressure increases triggered by sympathetic bursts are shown on left, and average vagal baroreceptor-cardiac gain estimated by cross-spectral and sequence methods are shown in center. The regression coefficients and the slope of the regression (gray line) in the Bland-Altman plot on the right did not show a systematic proportional bias between the two baroreflex measures. The horizontal dashed lines indicate tolerance interval within 95% confidence limits.