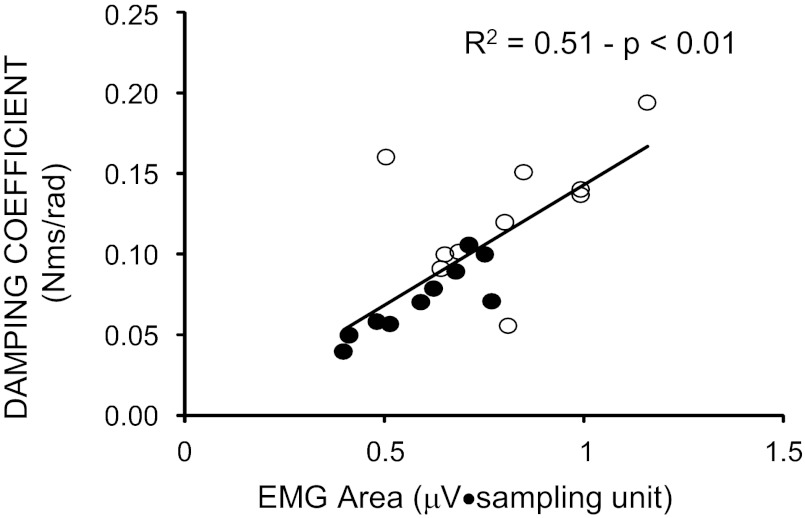
Fig. 8.
Relationship between the changes of mean values of damping coefficient and EMG area during the three cycles following the first flexion. The linear regression analysis was performed, collecting the data from both groups. Each data point represents the average value obtained over the 10 trials for each subject.

