Figure 1. .

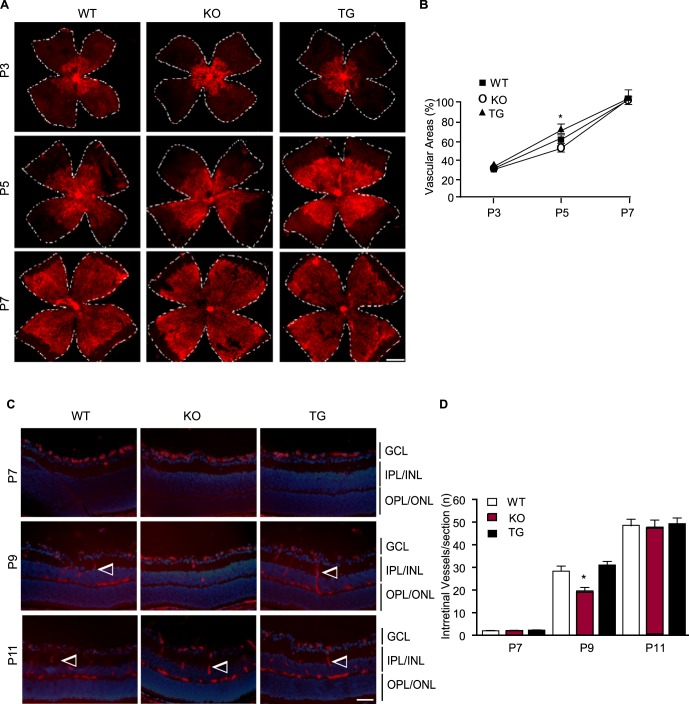
Effects of TNFR2 on retinal vascular development. Retinas from WT, TNFR2-KO, and TNFR2-TG were collected from P3 to P11. (A, B) The superficial retinal vasculatures were visualized by isolectin staining. Images from P3, P5, and P7 are shown (A). Scale bar: 500 μm. Vascularized areas were quantified as a percentage of the total retinal surface (B). n = 8 retinas from four mice for each strain. (C, D) Intraretinal vessels from the GCL into the deeper IPL and OPL layers were examined by isolectin staining of eye cross sections. Images from P7, P9, and P11 are shown, and intraretinal vessels are indicated by arrowheads (C). Scale bar: 50 μm. Intraretinal vessel number/section was quantified (D). Data are mean ± SEM from three sections of each retina and 12 retinas from six mice for each group. *P < 0.05 for TNFR2-KO compared to age-matched WT group.
