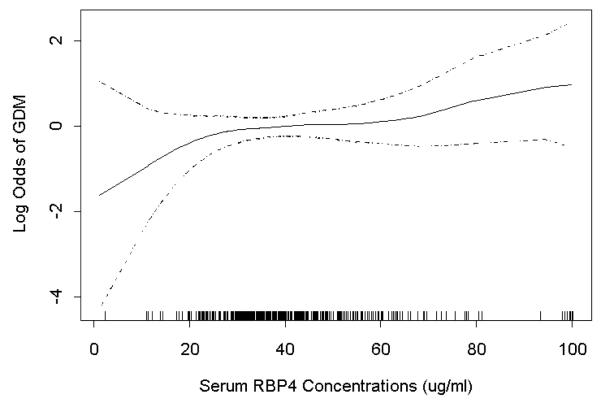
Figure 1.

Relation between maternal serum RBP4 concentrations (X-axis) and adjusted relative odds of gestational diabetes (GDM) (Y-axis). Estimates are depicted by the solid line while 95% CIs are depicted by the dotted lines. The vertical bars along the X-axis indicate distribution of study subjects. The estimates were adjusted for maternal age, race/ethnicity, family history of diabetes and pre-pregnancy overweight status.
