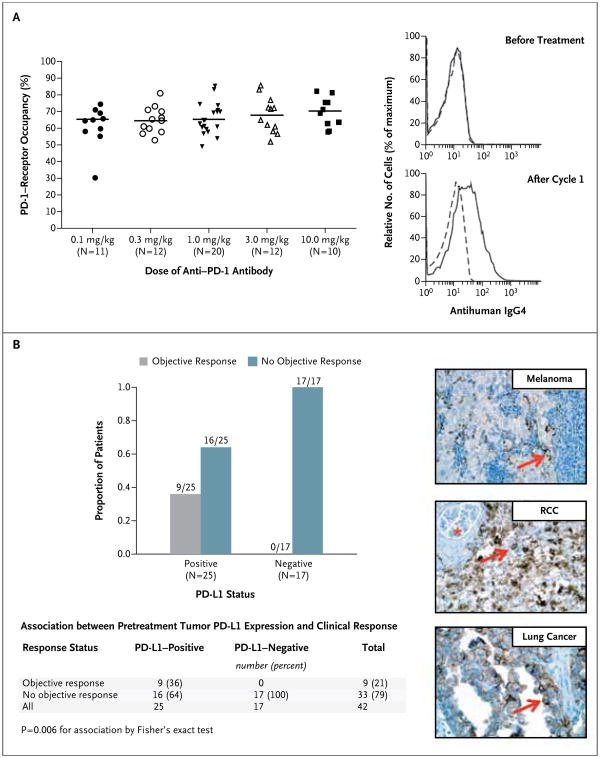
Figure 2. Pharmacodynamic and Molecular-Marker Assessments.

Panel A shows PD-1–receptor occupancy by anti–PD-1 antibody. The graph at the left shows PD-1–receptor occupancy on circulating T cells in 65 patients with melanoma after one cycle (8 weeks) of treatment at a dose of 0.1 to 10.0 mg per kilogram every 2 weeks. Bars indicate median values. The graphs at the right show PD-1–receptor occupancy on CD3-gated peripheral-blood mononuclear cells from a patient with melanoma who received 0.1 mg per kilogram, before treatment (top) and after one treatment cycle (bottom). Cells were stained with biotinylated antihuman IgG4 to detect infused anti–PD-1 antibody bound to PD-1 molecules on the cell surface. Detection was accomplished with the use of streptavidin–phycoerythrin, followed by flow-cytometric analysis. Dashed lines indicate isotype staining controls, and solid lines antihuman IgG4. Panel B shows the correlation of pretreatment tumor cell-surface expression of PD-1 ligand (PD-L1), as determined with immunohistochemical analysis of formalin-fixed, paraffin-embedded specimens, with an objective response to PD-1 blockade in 42 patients with advanced cancers: 18 with melanoma, 10 with non–small-cell lung cancer, 7 with colorectal cancer, 5 with renal-cell cancer, and 2 with castration-resistant prostate cancer. Tumor cell-surface expression of PD-L1 was significantly correlated with an objective clinical response (graph at the left). No patients with PD-L1–negative tumors had an objective response. Of the 25 patients with PD-L1–positive tumors, 2 who were categorized as not having had a response at the time of data analysis are still under evaluation. Shown at the right are immunohistochemical analysis with the anti–PD-L1 monoclonal antibody 5H1 in a specimen of a lymph-node metastasis from a patient with melanoma (top), a nephrectomy specimen from a patient with renal-cell cancer (RCC) (middle), and a specimen of a brain metastasis from a patient with lung adenocarcinoma (bottom). The arrow in each specimen indicates one of many tumor cells with surface-membrane staining for PD-L1. The asterisk indicates a normal glomerulus in the nephrectomy specimen, which was negative for PD-L1 staining.
