
Figure 3.
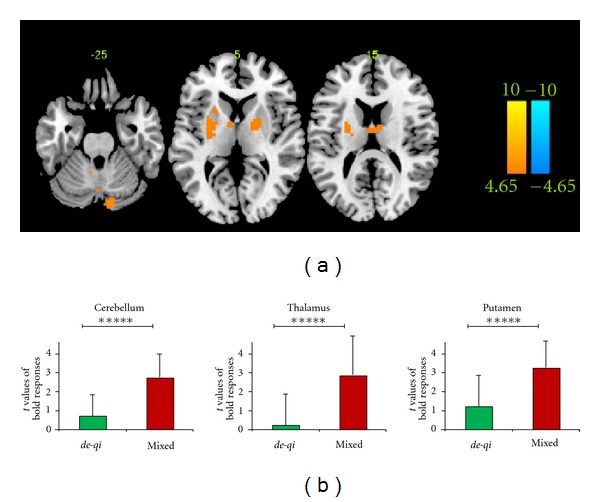
Different BOLD responses between groups. Panel (a) shows the between-group results of “mixed > de-qi” at P < 0.0001, uncorrected with 5 contiguous voxels. Panel (b) shows the mean t values of the BOLD responses in each ROI for both groups (*****is equivalent to P < 0.00001).