
Figure 3.
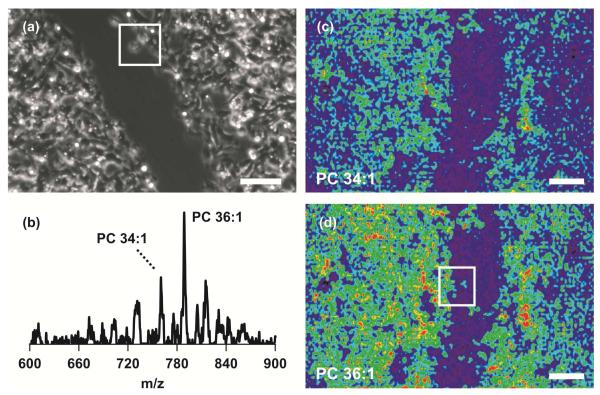
NIMS imaging and optical microscopy of cells. (a) Phase-contrast microscope image of scratch-wounded HT1080 cell monolayer on semi-transparent NIMS film. Scale bar is 250 μm. A single cell at the wound edge is contained in a 250 × 250 μm white box. (b) Single-pixel NIMS mass spectrum from wounded cell monolayer. Imaged masses are labeled. Mass spectrometry images of (c) PC 34:1 ([M+H]+ = 760.5 Da) and (d) PC 36:1 ([M+H]+ = 788.5 Da) allow cell membranes to be located. NIMS images were obtained with a spatial resolution of 14 μm. Signal intensities are expressed using a false coloring scale (low/blue → high/red). MS image scale bars correspond to 250 μm. Individual cells at the wound edge are contained in the 250 × 250 μm white box in part (d).