
Figure 3.
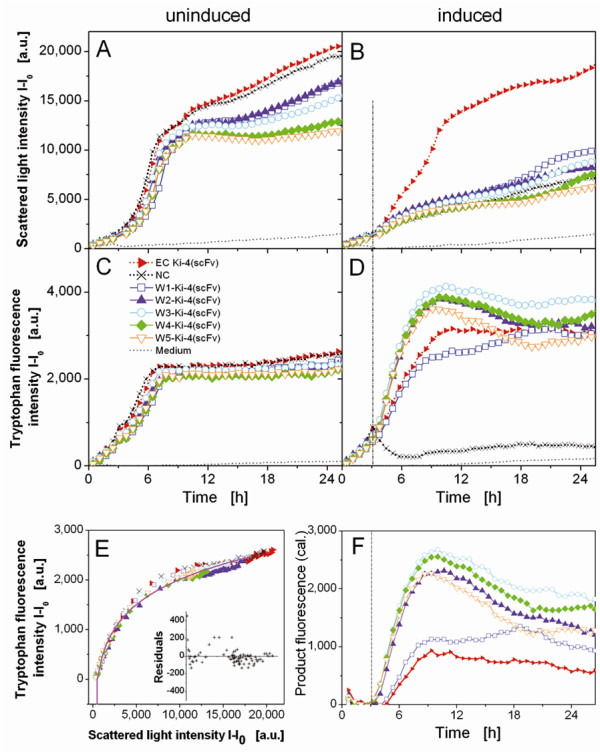
On-line detection of biomass formation and production of W-tag labelled Ki-4 (scFv). The intensities of (A,B) the scattered light (620 nm) and (C,D) tryptophan fluorescence (280/350 nm excitation/emission) were measured for the non-induced and induced cultures (induction with 1 mM IPTG is shown by the vertical broken line after 3.2 h). (E) For the non-induced cultures (no product), tryptophan fluorescence is plotted versus scattered light intensity (symbols). The appropriate fit shown as a continuous line (power function: fluorescence intensitycalc = 4780·[scattered light intensitymeas]0.077-7715). The plot of the residuals between the calculated and the measured fluorescence is displayed within the diagram as an inset box. (F) Product fluorescence intensity calculated by subtracting the biomass fluorescence of the non-induced cultures from the total fluorescence of the induced cultures.