
Figure 4.
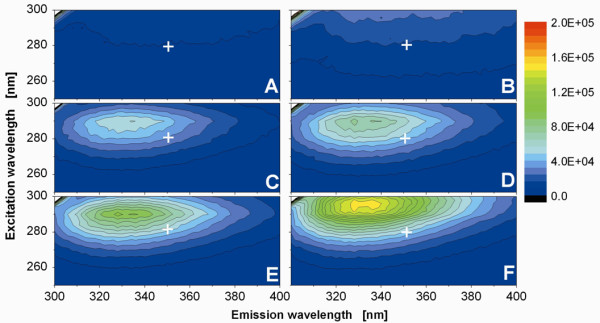
Two-dimensional fluorescence intensity scan of concentrated Ki-4(scFv) tagged with different Wx-tags. Depicted are fluorescence measurements of (A) an empty well, (B) 100% PBS buffer, (C) EC Ki-4(scFv), (D) W1-Ki-4(scFv), (E) W2-Ki-4(scFv) and (F) W3-Ki-4(scFv). For each well, the concentration of the Ki-4(scFv) and Wx-Ki-4(scFv) fusion proteins amounts to 3 μg/mL, harvested after 10 h cultivation. The 2D-scan shows that the increased fluorescence depends on the number of tryptophan residues in the tag. The empty well and PBS buffer do not generate significant signals. The cross in the diagram denotes the wavelength combination (280/350 nm excitation/emission) applied for the measurements.