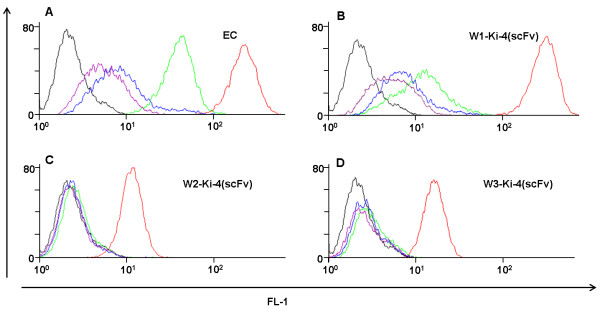
Figure 6.

Competitive flow cytometry of Ki-4(scFv), W1-Ki-4(scFv), W2-Ki-4(scFv), W3-Ki-4(scFv) against a monoclonal Ki-4 full flength antibody. (A) Ki-4(scFv), (B) W1-Ki-4(scFv), (C) W2-Ki-4(scFv) and (D) W3-Ki-4(scFv). The black curve displays the measurement of the L540cy cells incubated with the secondary antibody α-His AlexaFluor 488 (Qiagen, Germany), the red curve presents the binding measurement of the Wx-Ki-4(scFv) protein detected via the α-His AlexaFluor 488 antibody without competitive addition of the monoclonal Ki-4 full length antibody. The green curve displays the fluorescence intensity of the Wx-Ki-4(scFv) proteins after adding and co-incubation with 0.5 μg Ki-4 full length antibody. The blue curve presents the fluorescence intensity of the Wx-Ki-4(scFv) proteins after adding and co-incubation with 2 μg Ki-4 full length antibody and the purple curve after the addition of 5 μg Ki-4 full length antibody.
