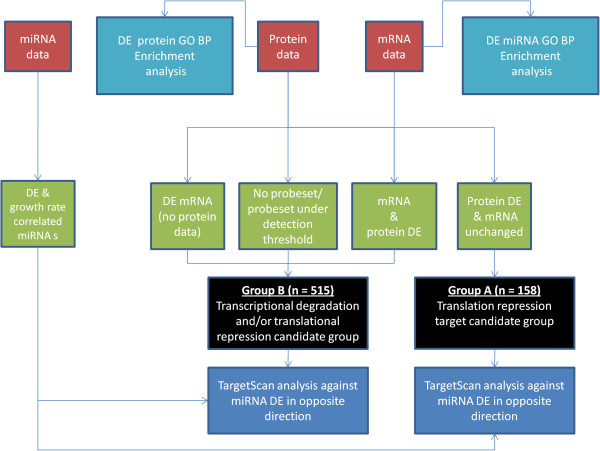
Figure 1.

Data analysis overview. Stage 1: Differential expression analysis between “fast” and “slow” groups for each of the 3 datasets. Stage 2: Enrichment analysis using DAVID to determine overrepresented GO biological processes in the DE mRNA and protein lists. Stage 3: mapping of DE proteins to microarray probesets, output of two target groups; Group A contains potential targets of miRNA translational repression (protein DE without mRNA change), Group B contains translation repression and/or transcriptional degradation targets (contains DE mRNA & DE proteins where no microarray information was available/probeset was below detection level or both mRNA and protein were DE). Stage 4: TargetScan analysis of both groups against miRNAs DE in the opposite direction.
