Figure 5.

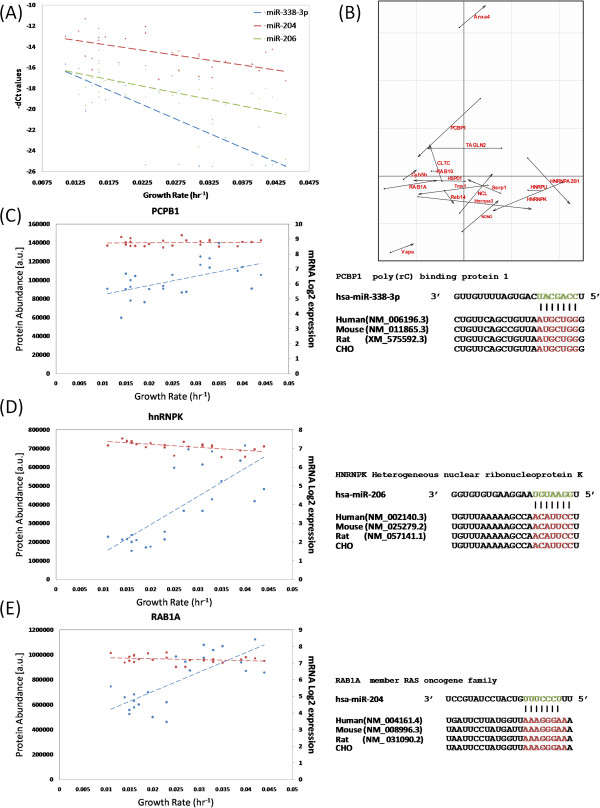
Group A proteins upregulated and predicted to be targeted by selected downregulated miRNAs. (A) The expression of miR-338-3p, miR-206 and miR-204 decreases as growth rate increases. (B) Normalised CIA score plot showing the divergence between mRNA and protein expression profiles for miR-338-3p, miR-206 and miR-204 TargetScan predictions. Each predicted target is represented by an arrow, the length of which corresponds to the divergence between mRNA (circular base) and protein (arrowhead) expression across the dataset. Potential post-transcriptional regulation of (C) PCBP1, (D) hnRNPK and (E) RAB1A. For each of the three targets the mRNA expression (red) remains constant while the protein expression increases (blue) for the 24 samples where both mRNA and protein data was available. The conserved (human, mouse, rat and CHO) binding site to the seed region of the miRNA cluster is shown to the right for each protein.
