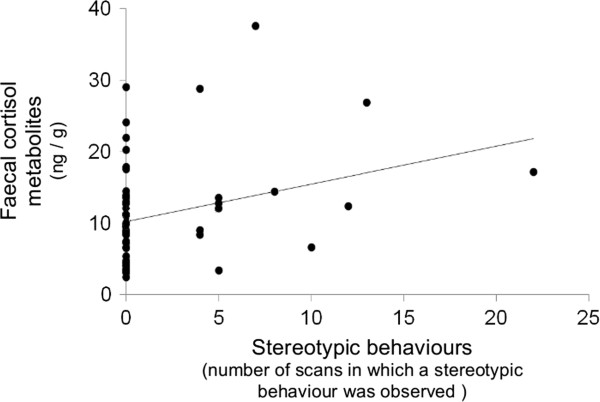
Figure 3.

Faecal cortisol metabolites concentrations (ng/g) function of number of scans in which a stereotypic behaviour was observed in Arab mares (study 2, N = 58). Samples were collected between 08:00 and 10:00. Original data are presented for clarity (data were log transformed for analysis). The number of scans in which a stereotypic behaviour was observed did not predict faecal cortisol metabolites concentrations (F 1, 47 = 0.003, P = 0.96).
