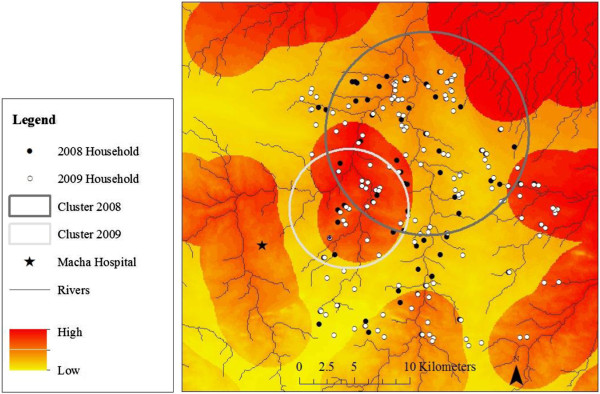
Figure 3.

Spatial clusters of recent malaria cases identified serologically and ecological predictors of malaria transmission. Study households are shown in black (2008) and white (2009) dots. Spatial clusters of households comprising residents with serologic evidence of recent malaria infection are shown in the large circles (2008 = grey; 2009 = light grey). The background consists of a malaria risk map based on ecological features of the terrain [20], with the darker red indicating a higher risk of malaria.
