
Figure 5.
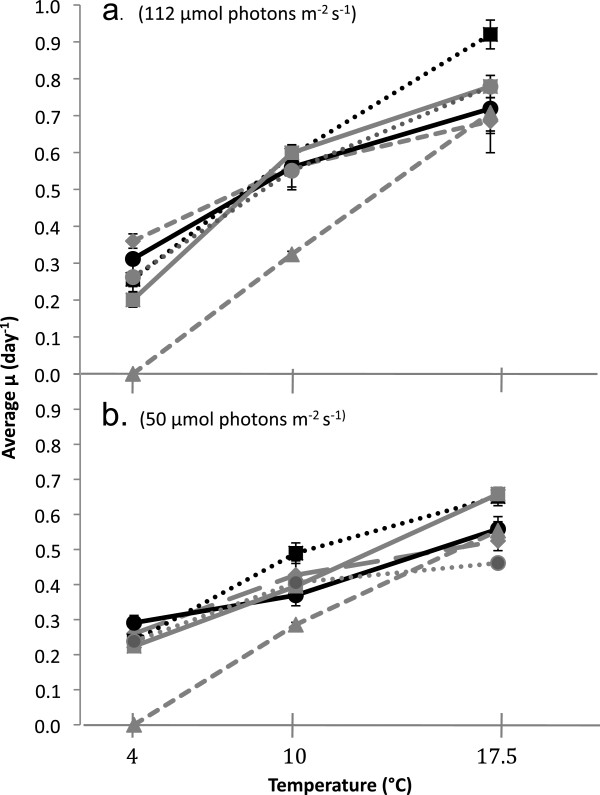
Physiological Experiments. Black lines represent lineage 1, grey lines represent lineage 3. a) Growth rates for six strains at 4, 10, and 17.5°C, high light (112 μmol photons m-2 s-1) b) Growth rates for six strains at 4, 10, and 17.5°C, low light (50 μmol photons m-2 s-1).