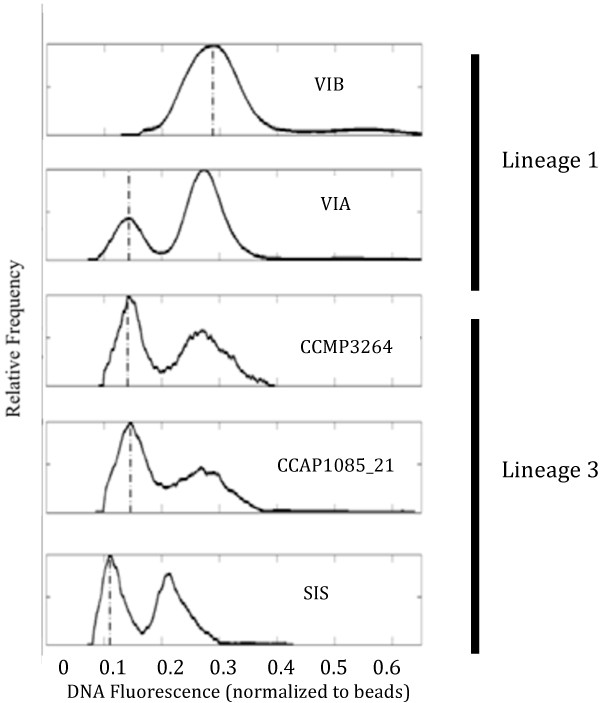
Figure 6.

Genome Size. Average integrated fluorescence signal for five strains of T. rotula measured at G1 and G2 cell phases, measured using the IFCB. Fluorescence is normalized to 6um beads. Dotted line represents mode fluorescence of each strain in G1 cell phase.
