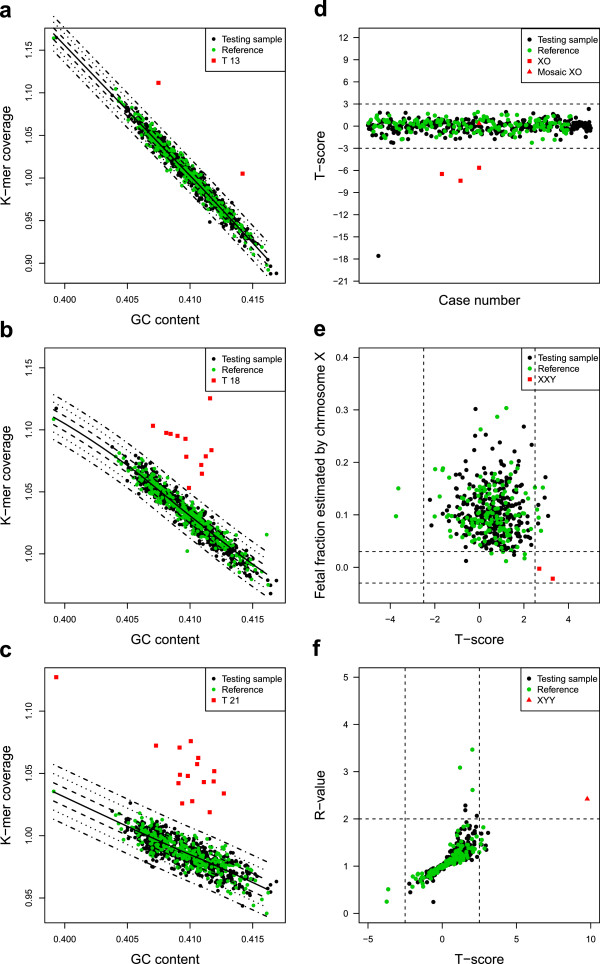
Figure 3.

Fetal aneuploidy detection using NIFTY test. a-c, The k-mer coverage (y-axis) of 903 samples was plotted with corresponding GC content (x-axis) for chromosome 13,18 and 21. The solid black line is the fit between the k-mer coverage and GC content among the 300 controls. The dot-dash lines from inside to outside are the contour lines of t=1, t=2 and t=3 respectively. d, XO detection. The t-score of chromosome X for 452 cases with female fetuses and 4 XO cases is dotted. The t-score less than −2.5 indicates XO aneuploidy. e, XXY detection. The x-axis is the t-score of chromosome X for samples carrying male fetuses. The y-axis is the fetal fraction estimated by chromosome X. Red square points indicated XXY cases that have a t-score larger than 2.5 and the cff-DNA concentration estimated by chromosome X nearly equal to zero. f, XYY detection. The x-axis is t-score for chromosome X among samples carrying male fetuses. The y-axis is the R-value, i.e. the ratio of the fetal DNA fraction estimated by chromosome Y to that estimated by chromosome X. Red triangle points indicate XYY cases with t-score greater than 2.5 and R-value greater than 2. The case types are color coded (black: testing samples; green: reference samples; red: aneuploidy samples).
