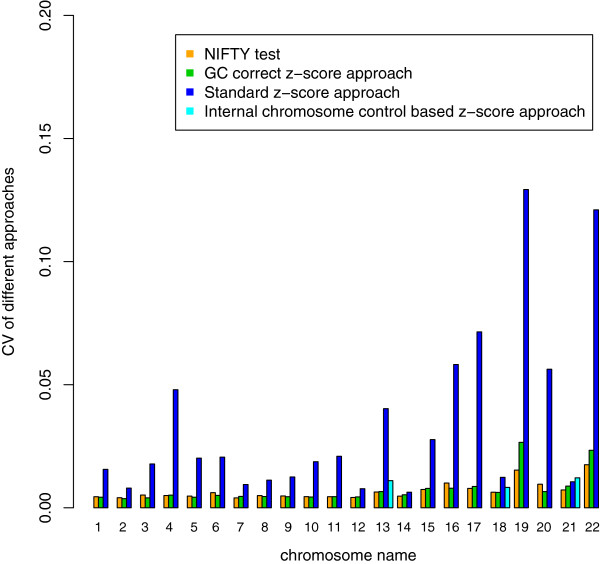
Figure 4.

The Performance of three methods: coefficient of variation (CV). We calculated the CVs (y-axis) among the different chromosomes (x-axis) for the 903 samples with karyotyping. The different methods are the color-coded (Orange: NIFTY test; Green: GC correct z-score approach; Dark Blue: Standard z-score approach; Light Blue: Internal chromosome control based z-score approach). In the clinically interesting chromosomes (13, 18, 21), our approach obtained the lowest CVs, indicating a higher sensitivity.
