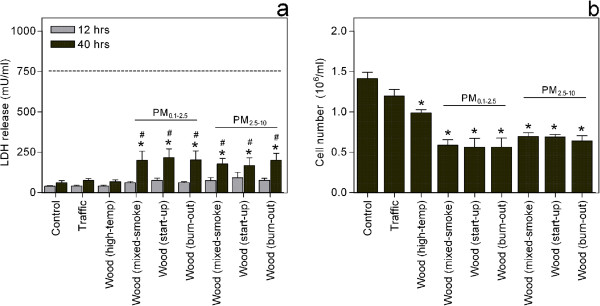
Figure 2.

Particle-induced changes in cytotoxicity and number of viable cells. Co-cultures of pneumocytes (A549) and monocytes (THP-1) were exposed to particles at a concentration of 40 μg /cm2, before determining a) levels of LDH in the cell culture supernatants after 12 or 40 h exposure and b) the number of viable cells by tryan blue exclusion after 40 h exposure. The dotted line represents the maximum LDH level, which corresponds to the levels that would have been measured if all the cells in the wells were dead. Histograms represent means ± SEM of separate experiments (n = 4). * p<0.05 exposed vs. control and # p<0.05 12 vs. 40 h exposure. Statistical analysis was in a) performed by 2-way-ANOVA with Bonferroni post-tests on log transformed data and in b) by one-way-ANOVA with Bonferroni post-tests.
