
Figure 2. Structure of the homeodomain.
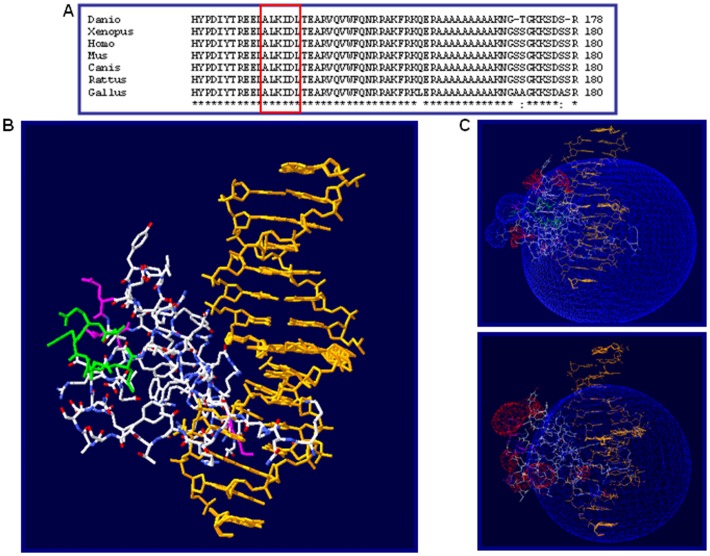
(A) Multiple sequence alignment among different species. Aminoacid residues involved in the deletion are included within a red box. (B) Three-dimensional representation of the interaction between the Drosophila sp. homeodomain and the target DNA sequence (orange). Aminoacids encompassed by the deletion are represented in green. C) Prediction of the electrostatic potential for the wild type protein (up) and the mutated one (down). Negative charge is represented in blue and positive charge in red.