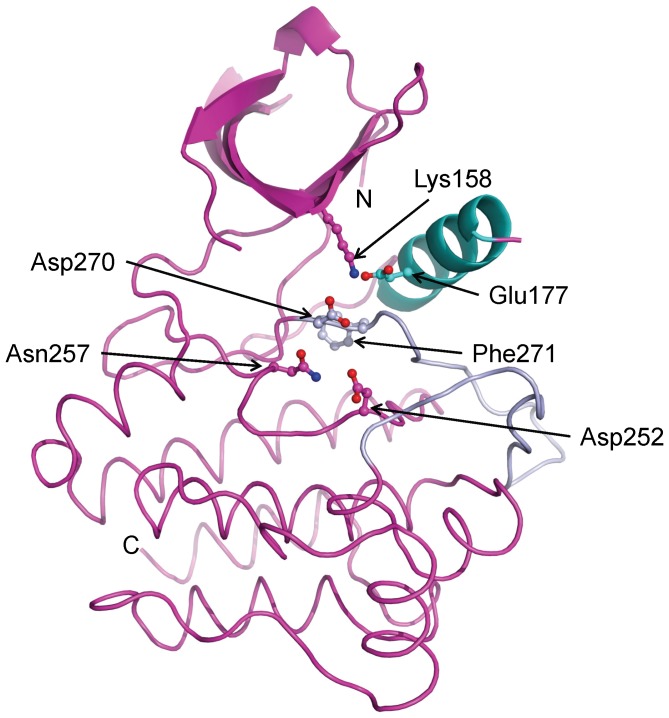
Figure 2. The activated state of the Ack1 kinase domain.

For clarity, secondary structure for only the N-terminal lobe is displayed. The activation loop is shown in light blue and the αC helix in cyan. Functionally important residues are highlighted.
