
Figure 6. Differences and similarities between the inactive and active states of Ack1 kinase domain.
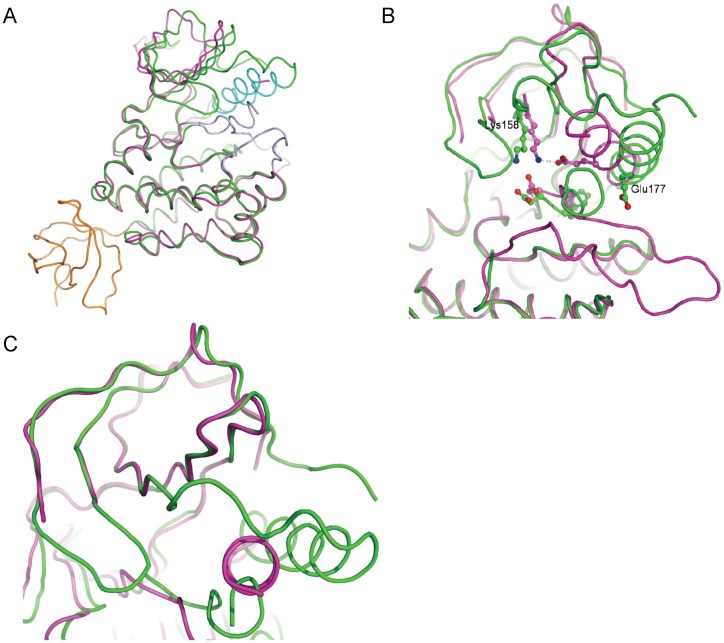
The inactive kinase domain is shown in green, the SH3 domain in orange and the active kinase domain in magenta. (A) Overall superposition of the kinase domain in the two states show the different orientations of the N-lobes relative to the C-lobe. RMSD of the Cα positions of the C-lobe residues 292–389 is 0.6 Å between the two states. The αC helices are highlighted in cyan and the activation loops in light blue. (B) Close-up of the ATP-binding pocket shows the changes accompanying the activation of the kinase domain. The beginning of the helical A-loop can be seen in the inactive state, while in the activated state, it is in the extended conformation. The Lys158– Glu177 ion-pair of the activated state is broken, and the αC helix is rotated away from the ATP-binding site in the inactive state. (C) Superposition of the N-terminal lobe shows that the overall conformation, except the αC helix, changes little between the two states. The β-sheet and α-helix move independently as rigid bodies relative to the C-lobe through the catalytic cycle.