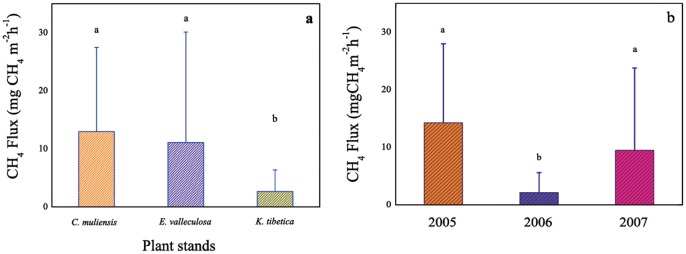
Figure 3. Spatiotemporal variation of CH4 fluxes.

a. Mean CH4 fluxes in different stands during the growing seasons; b. Inter-annual variation of CH4 emission from the open fen of 2005 to 2007. Different letters indicate significant difference for each panel (P<0.05).
