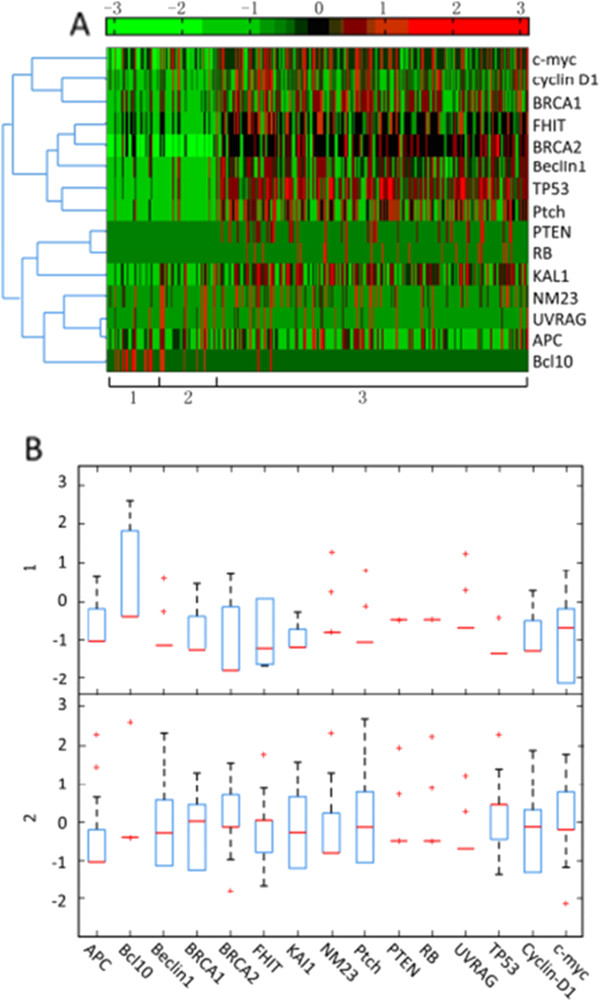
Figure 2.

RNA in situ hybridization expression profile of 15 tumor-related genes between normal tissue adjacent to cancerous tissue and normal tissue adjacent to benign tissue from 314 patients. (A) Heat map and tree map of RISH expression for 15 TRGs. (1) and (2) NTAB in thyroid and breast tissue. (3) NTAC for all malignant tumors. Units −3 through +3 represents the scale of gene expression corresponding to the sample. (B) Box plot distribution of TRG expression in (1) NTAB and (2) NTAC for 314 biopsies. NTAB: normal tissue adjacent to benign tissue; NTAC: normal tissue adjacent to cancerous tissue; RISH: RNA in situ hybridization; TRG: tumor-related gene.
