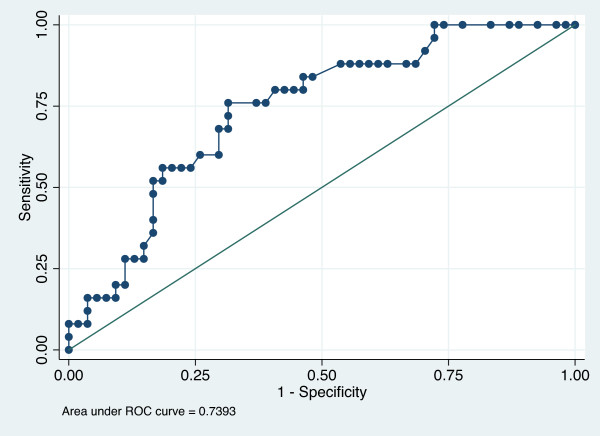
Figure 1.

ROC curve evaluating quality of the model including SAPS II and AIDS-related diagnosis to determine 6-month mortality risk. The quality of the multiple logistic regression analysis model was evaluated through its measures of sensitivity and specificity with establishment of a ROC curve. Aera under the ROC curve was 0.7393.
