
Figure 3. Prevalence of femoral hernia repair stratified by age and gender.
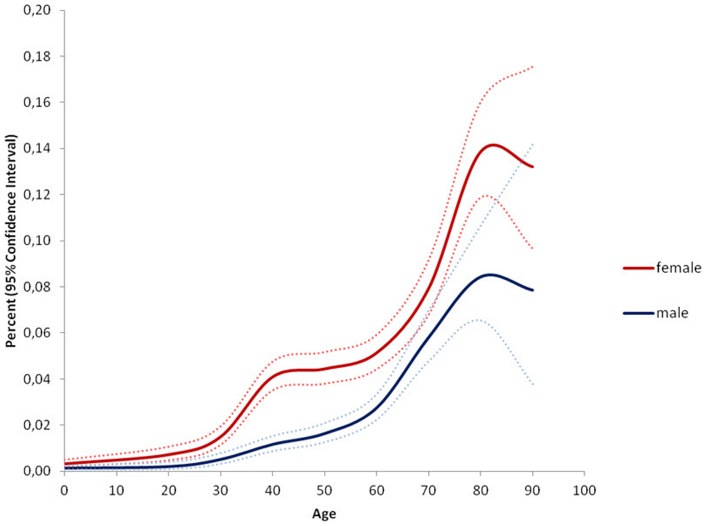
The results indicate the percentage of persons at a given age in the population who were operated for a femoral hernia during the study period. Example: 0.14% CI 0.12–0.16% of all females aged 80–90 years in Denmark were operated for a femoral hernia at least once during the study period.