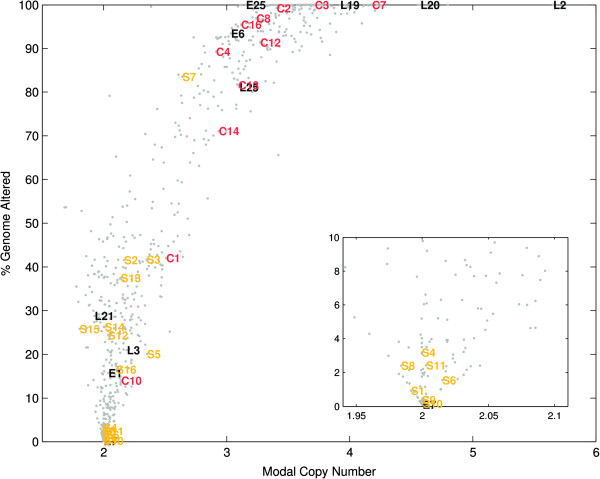
Figure 1.

The distribution of genomic complexity for (C)IN, MAC(S), (E)arly and (L)ate-onset colorectal cancer. Data for 636 samples (grey) from the Ludwig Colon Cancer Initiative data set was used as background reference. (Inset) Expanded view showing clustering of samples with few genomic aberrations.
