
Figure 2 .
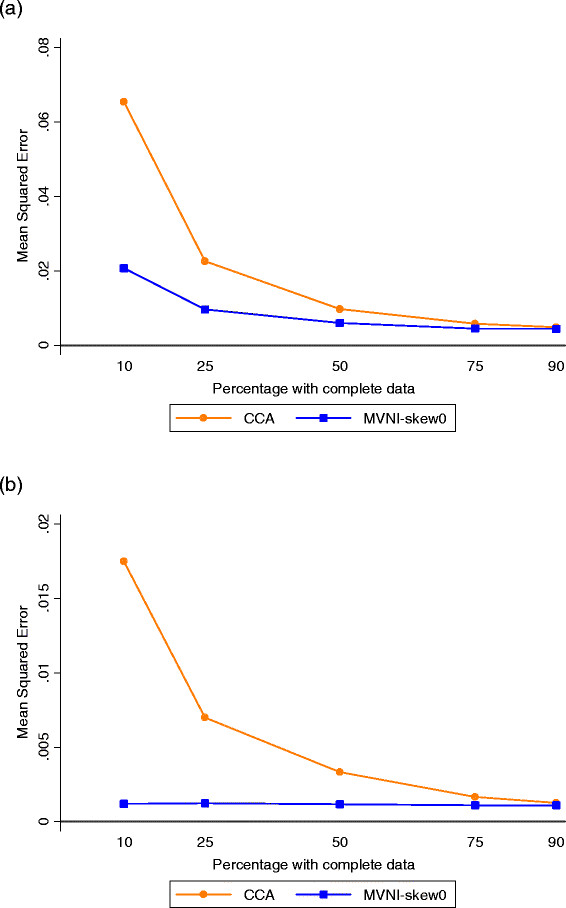
Mean Squared Errors from regression of (continuous) distress at Wave II with missing dieting indicator. a) Diet, b) Emotional Distress at Wave I Results presented are the average Mean Squared Error across the 1000 simulated datasets in the parameter estimates from linear regression of (continuous) emotional distress at Wave II from Equation 1, with missing data on the dieting indicator. CCA = Complete Case Analysis; MVNI = Multivariate normal imputation.