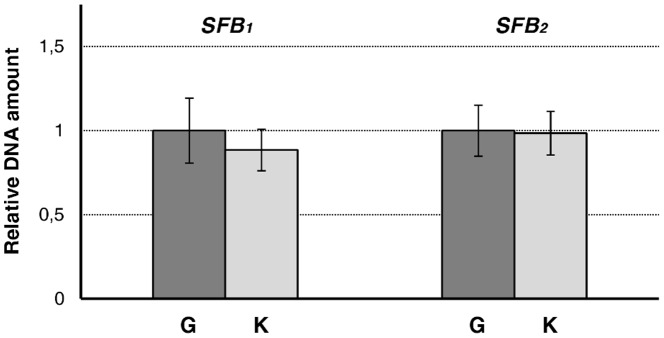
Figure 2. Relative DNA amount of SFB 1 and SFB 2 in ‘Goldrich’ (G) and ‘Katy’ (K).

Quantities correspond to the average of two independent biological replicates repeated three times and were determined using actin as endogenous control. Bars indicate standard deviations.
