

Abstract
Soil organic carbon (SOC) actively participates in the global carbon (C) cycle. Despite much research, however, our understanding of the temperature sensitivity of soil organic carbon (SOC) mineralization is still very limited. To investigate the responses of SOC mineralization to temperature, we sampled surface soils (0–10 cm) from evergreen broad-leaf forest (EBF), coniferous forest (CF), sub-alpine dwarf forest (SDF), and alpine meadow (AM) along an elevational gradient in the Wuyi Mountains, China. The soil samples were incubated at 5, 15, 25, and 35°C with constant soil moisture for 360 days. The temperature sensitivity of SOC mineralization (Q10) was calculated by comparing the time needed to mineralize the same amount of C at any two adjacent incubation temperatures. Results showed that the rates of SOC mineralization and the cumulative SOC mineralized during the entire incubation significantly increased with increasing incubation temperatures across the four sites. With the increasing extent of SOC being mineralized (increasing incubation time), the Q10 values increased. Moreover, we found that both the elevational gradient and incubation temperature intervals significantly impacted Q10 values. Q10 values of the labile and recalcitrant organic C linearly increased with elevation. For the 5–15, 15–25, and 25–35°C intervals, surprisingly, the overall Q10 values for the labile C did not decrease as the recalcitrant C did. Generally, our results suggest that subtropical forest soils may release more carbon than expected in a warmer climate.
Introduction
The dynamics of soil organic carbon (SOC) mineralization is an important issue in global climate change [1]–[2], as SOC mineralization plays an important role in regulating global atmospheric CO2 concentration. Many factors, such as soil temperature [3]–[4], soil structure [5], soil moisture [6]–[7], characteristics of soil micro-organisms and microbial community [8], and substrate quality and availability [9], influence SOC mineralization. In the context of global warming, however, it is particularly important to understand the temperature sensitivity of soil carbon (C) mineralization. It is anticipated that ecosystems may exert a positive feedback to the rising temperatures because of the stronger response of decomposition to temperature than that of net primary productivity [10]–[11]. If the amount of plant-derived C incorporated into soil exceeds the C loss through decomposition, on the other hand, a negative feedback may occur.
In order to investigate the SOC mineralization-temperature relationship, temperature response functions are essential to simulate the effects of global warming on the mineralization of soil C pools [12]–[13] and the potential feedback to current global warming [1], [14]. However, a majority of the simulation models used to predict the fate of the soil C stock under global warming utilize the same coefficient for simplicity as the indicator of the temperature sensitivity of SOC decomposition regardless of the ecosystem types, bio-climatic zones, or the stability of the organic matter pools [3], [15]. Previous studies indicate that the temperature sensitivity of SOC mineralization varies, depending on the types of SOC and the extent of SOC being mineralized. Additionally, knowledge on whether the labile C has relatively lower temperature sensitivity than that of the recalcitrant C is still limited [16]–[21], constraining our accuracy in predicting feedbacks of potential C dynamics to future climate change.
Global mean temperature is predicted to increase another 2–7°C by the end of this century [22] and is anticipated to significantly influence microbial mineralization of soil organic matter [23]. Laboratory incubations of soil provide us a useful way to study the intrinsic temperature sensitivity of SOC decomposition with few confounding impacts of the many factors influencing Q10 values in field conditions [24]. Some earlier studies proved that the temperature sensitivity of decomposition decreased with increasing temperature given lower Q10 values at higher temperatures [3], [25]. Others showed that Q10 values varied largely across the range of temperatures, which were low at low temperature interval (0–10°C), increased at median temperature interval (10–20°C), and then decreased at high temperature interval (20–30°C) [26]. Studying the temperature sensitivity of SOC mineralization at different temperature intervals around 15°C (because the mean annual temperature is 15°C for the Wuyi Mountains) is particularly importantly important for understanding the dynamics of soil C pools under warmer temperatures. At present, much attention has been paid to the responses of SOC mineralization to temperature changes in the tropical, temperate, and boreal regions [27]–[29]. Studies in the subtropical regions are rare but of great importance, especially along an elevational gradient because temperature changes in mountains along an elevation can be similar to that caused by latitudinal gradients [26], [30].
The variations along an elevation in mountainous areas provide a unique opportunity to study the SOC mineralization-temperature relationship [31]–[33]. In particular, soils along elevation gradients are sensitive to multiple environmental factors that have interacted over long periods of time and they are suitable for testing the effect of warmer temperatures on SOC mineralization [33]–[36]. Compared to the regions at the same latitude in the world, the Wuyi Mountains have the largest and the most well-preserved subtropical forest ecosystems. Moreover, elevational gradients of temperature changes could resemble those observed along latitudinal gradients [26]. We studied SOC mineralization-temperature relationship in this study and the specific aims were to: (1) examine the variation in the Q10 values of SOC mineralization along with the increasing extent of SOC being mineralized; and (2) investigate the effects of elevation and incubation temperature intervals (5–15°C, 15–25°C, and 25–35°C) on Q10 values.
Materials and Methods
Site Description
Our experimental sites are located in the Wuyishan National Nature Reserve Area in Fujian Province (27°33′–27°54′N, 117°27′–117°51′E), a 56,527 ha forested area in the southeastern China. Mean annual temperature (MAT), relative humidity, and annual precipitation (AP) for this area are 18°C, 83.5%, and 2,000 mm, respectively. Four typical vegetation types are distributed along the elevation gradient: evergreen broad-leaf forest (EBF), coniferous forest (CF), sub-alpine dwarf forest (SDF), and alpine meadow (AM) [37]–[38].
The first site is located in a 1,175 ha subtropical EBF at 500 m above sea level (asl) with the AP of 1,700 mm. MAT was 18°C [37]–[38]. Castanopsis carlesii with an average height of 14.7 m was the prevailing tree species at this site. The second site is a temperate CF, locating at an elevation of 1,150 m (asl), with the MAT of 14.5°C [39] and the AP of 2,000 mm [38]. The forest was dominated by Pinus tanwanensis trees with a mean diameter of 22 cm at breast height (DBH). The third site at an elevation of 1,750 m (asl) is a SDF with an AP of 2,200 mm and the MAT of 11.2°C [38]–[39]. The dominant tree species at this site were Symplocos paniculata and Stewartia sinensis with the average tree height 4.5 m. The fourth site, AM, is located at an elevation of 2,150 m (asl) and was close to the highest mountain in the southeastern China. The AP was 3,100 m and the MAT was 9.7°C [38]–[39]. The site was covered by grasses with an average height of 25 cm and the dominant species were Calamagrostis brachytricha, Miscanthus sinensis, and Lycopodium clavatum. Detailed site conditions are shown in Table 1.
Table 1. Table 1. Site conditions.
| Site | Elevation(m) | AP (mm) | MAT (°C) | Soil Moisture(%) | Soil Temperature (%) | SOC (g kg−1) | TN (g kg−1) | C/N | pH | Bulk density (g cm−3) |
| EBF | 500 | 1,700 | 18 | 22.43±0.12d | 16.77±0.11a | 44.78±0.44d | 5.46±0.04c | 8.20±0.03c | 4.67±0.05b | 0.962±0.10a |
| CF | 1,150 | 2,000 | 14.5 | 36.52±1.83c | 12.70±0.05b | 59.63±2.92c | 5.27±0.02d | 11.31±0.54b | 4.10±0.02d | 0.795±0.06b |
| SDF | 1,750 | 2,200 | 11.2 | 51.91±1.34b | 11.83±0.09c | 96.27±1.75b | 8.05±0.02b | 11.96±0.21b | 4.55±0.02c | 0.708±0.04c |
| AM | 2,150 | 3,100 | 9.7 | 55.47±0.53a | 11.19±0.06c | 140.45±3.66a | 10.06±0.02a | 13.96±0.34a | 4.83±0.01a | 0.667±0.05c |
Note: AP, annual precipitation; MAT, mean annual temperature; SOC, soil organic carbon; TN, total nitrogen; EBF, evergreen broad-leaf forest; CF, coniferous forest; SDF, sub-alpine dwarf forest; AM, alpine meadow. Values are mean±SE. Different letters within a column indicate significant differences at P<0.05. Datasets of AP are obtained from a previous study37.
Experimental Design and Soil Sampling
Four replicate plots (25 m×30 m) were randomly set up in each forest (EBF, CF, and SDF) and in AM along the elevational gradient at the Wuyi Mountains. In late April, 2007, we randomly collected surface soil samples (0–10 cm) from all the 25 m×30 m plots using a 2 cm-diameter soil corer. Each soil sample was a composite of twenty cores. Samples were immediately sieved (<2 mm) to remove soil fauna, rocks and fine roots, thoroughly hand-mixed, placed in plastic bags and transported in several coolers to our laboratory at the Nanjing Forestry University. We kept the soil samples in a refrigerator at 5.0°C before being used for incubation. A small part of each soil sample was air-dried, ground, and sieved through a 0.25 mm sieve to measure SOC and other chemical properties.
Soil Incubation and Chemical Analyses
The soil samples (100 g) went through a two-week pre-incubation at 15°C and 75% of field capacity to avoid the “pulsing effect”, which may result in a rapid mineralization of SOC. Then, they were incubated in 1 L Mason jars at 5, 15, 25, and 35°C (±1°C) for 360 days in four LRH-450 incubators (Medicine Machinery Co. Ltd., Shanghai, China). Meanwhile, controls (without soil samples) were also incubated in the incubators. Small vials (50 ml, with no lids) containing 30 ml of 1 M NaOH solution were periodically placed in each Mason jar to trap respired CO2 [40]. Samples were taken after 7, 14, 21, 35, 49, 63, 78, 93, 110, 130, 150, 170, 190, 210, 235, 260, 285, 310, 335 and 360 days by removing the NaOH vials. To calculate the C mineralization rate, the amount of CO2 was determined by titration of the NaOH with 1 M HCl to pH 8.3 in the presence of BaCl2. Then, the mason jars were flushed with compressed air to allow replenishment of O2 after each interval and deionized water was added to maintain moisture at 75% of field capacity.
Soil organic carbon (SOC), total nitrogen (TN), and total sulfur (TS) were measured using a CNS Macro Elemental Analyzer (Elementar Analysen Systeme GmbH, Germany). Soil moisture was determined by oven-dry soil samples at 105°C and was expressed on a dry mass basis. Soil pH was measured in soil/H2O suspension (1∶2.5, w/w) with a 716 DMS Titrino pH meter (Metrohm Ltd. CH.-901 Herisau, Switzerland) fitted with a glass electrode. Soil bulk density was determined by soil coring.
Statistical Analysis
The temperature sensitivity (Q10) of SOC mineralization during the incubation was calculated according to Xu et al. [37]:
where tc and tw are the time required to respire a given amount of soil C at relatively cold (T c) and warm (T w) temperatures during incubation. The first 8% of the initial C was considered to be relatively labile and the rest to be recalcitrant [18], [37]. The Q10 values for the labile C pool were estimated by dividing the time taken to mineralize the first 1% of initial C at cold temperature (e.g. 15°C) by that at warm temperature (e.g. 25°C). For the recalcitrant organic C (ROC) pool, Q10 values were determined using the time taken to respire an additional 1% of initial C after 8% of initial C was decomposed. Q10 values based on the calculation of the time need to mineralize the same amount of C at different incubation temperatures could ensure that we were comparing the SOC being mineralized at the same extent and eliminating the confounding effect arisen from the changes in substrate availability with time.
We used one-way ANOVA to identify the differences in soil chemical properties, cumulative SOC mineralized during the whole incubation, and the Q10 values. Two-way ANOVA analyses were performed to examine the effects of elevation and temperature intervals of incubation for the Q10 values, including Q10-labile and Q10-recalcitrant values. All statistical analyses were conducted using SPSS 16.0 software (SPSS Institute Inc., Chicago, IL, USA).
Results
SOC Mineralization
Laboratory incubation temperatures significantly influenced the mineralization rates of SOC (Fig. 1). Both the mineralization rates (Fig. 1A, 1B, 1C, 1D) and the proportion of the cumulative C mineralized during the whole incubation period (Fig. 1E, 1F, 1G, 1H) increased with increasing incubation temperatures. In EBF during the first incubation cycle (the first 7 days), for example, the average mineralization rate at 35°C was 3.34, 2.60, and 2.06 times higher than those at 5, 15, and 25°C. The mineralization rates of SOC declined substantially over the entire incubation period across the incubation temperatures and the four elevational vegetation types. The incubation temperatures significantly affected the cumulative C mineralized that increased with increasing temperatures across the four vegetation types. The mineralization rates of SOC decreased and leveled off as the incubation proceeded (Fig. 1). After 360 days of incubation, at least 6.15% of the initial C, found in the soil samples incubated at 5°C in AM, had been mineralized.
Figure 1. Variation in the rates of SOC mineralization during the whole incubation at different incubation temperatures (5, 15, 25, and 35°C) in EBF (a), CF (b), SDF (c), and AM (d).
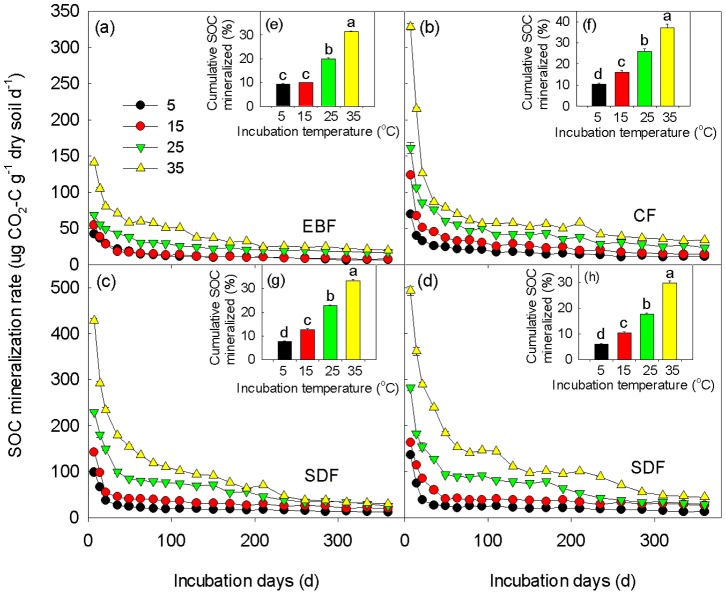
Inserted panels e for EBF, f for CF, g for SDF, and h for AM show the cumulative percent of SOC mineralized during the whole incubation. Different letters indicate significant differences in the cumulative percent of SOC mineralized among different incubation temperatures at P<0.05. Values are Mean±SE. EBF, evergreen broadleaf forest; CF, coniferous forest; SDF, sub-alpine dwarf forest; AM, alpine meadow.
Sensitivity of SOC Mineralization to Temperatures
The temperature sensitivity of SOC mineralization (Q10) increased with increasing incubation time (Table 2). This phenomenon held true across all the incubation temperature intervals along the elevation gradient. Both the elevation and the incubation temperature intervals had significant effects on Q10 values at different time points during the incubation (all P<0.05, Table 2). Q10 values increased greatly with increasing elevations both for the labile and recalcitrant SOC (P = 0.004 and 0.078, respectively, Fig. 2A, 2B). With increasing incubation temperature intervals, however, Q10 values did not linearly increase (all P>0.05, Fig. 2C, 2D). In EBF and AM, specifically, Q10 values did not changed from the 15–25°C interval to the 25–35°C interval (Table 2, P>0.05). Overall, the Q10 for the recalcitrant SOC mineralization was much higher than that of the labile (P<0.05, Fig. 3A). Surprisingly, we found that the Q10 values for the labile SOC mineralization were higher at higher temperature intervals (Fig. 3B). For the recalcitrant SOC mineralization, however, the Q10 values decreased with increasing temperature intervals.
Table 2. Results of two-way ANOVA for Q10 values at different temperature intervals in the four elevational vegetation communities.
| Vegetation | Temp. interval (°C) | 1%-Labile | 1–2% | 5–6% | 8–9%-Recalcitrant |
| EBF | 5–15 | 1.28±0.03 | 1.22±0.05 | 2.01±0.10 | – |
| 15–25 | 1.34±0.03 | 1.70±0.03 | 2.92±0.07 | 3.12±0.12 | |
| 25–35 | 1.26±0.03 | 2.03±0.01 | 2.22±0.07 | 2.22±0.07 | |
| CF | 5–15 | 1.32±0.08 | 1.42±0.21 | 1.97±0.03 | – |
| 15–25 | 1.30±0.02 | 1.72±0.05 | 2.15±0.03 | 3.91±0.08 | |
| 25–35 | 1.60±0.12 | 2.50±0.20 | 3.00±0.09 | 2.91±0.11 | |
| SDF | 5–15 | 1.58±0.07 | 1.66±0.06 | 1.93±0.05 | – |
| 15–25 | 1.67±0.01 | 2.55±0.15 | 2.60±0.09 | 3.69±0.09 | |
| 25–35 | 1.86±0.04 | 2.03±0.05 | 2.70±0.09 | 3.24±0.04 | |
| AM | 5–15 | 1.40±0.03 | 1.88±0.03 | 2.34±0.06 | – |
| 15–25 | 1.86±0.07 | 2.45±0.05 | 2.43±0.02 | 4.62±0.12 | |
| 25–35 | 1.75±0.04 | 2.31±0.07 | 2.94±0.17 | 3.32±0.06 | |
| Source of variation | |||||
| Elevation | * | * | * | * | |
| Temp. interval | * | * | * | * | |
| Elevation×Temp. interval | * | * | * | * | |
Note: EBF, evergreen broadleaf forest; CF, coniferous forest; SDF, sub-alpine dwarf forest; AM, alpine meadow. An asterisk represents significant effect of elevation or incubation temperature interval on Q10 values at P<0.05. 1%, 1–2%, 5–6%, and 8–9% stand for the mineralization of the first, second, sixth, and ninth percent of SOC. Missing values for the 8–9% at 5–15°C are because some soils incubated at 5°C did not respire 9% of the total C during the incubation period.
Figure 2. Relationship of Q10 values with mean annual temperature (MAT) of the different elevations (a, b) and incubation temperature intervals (c, d).
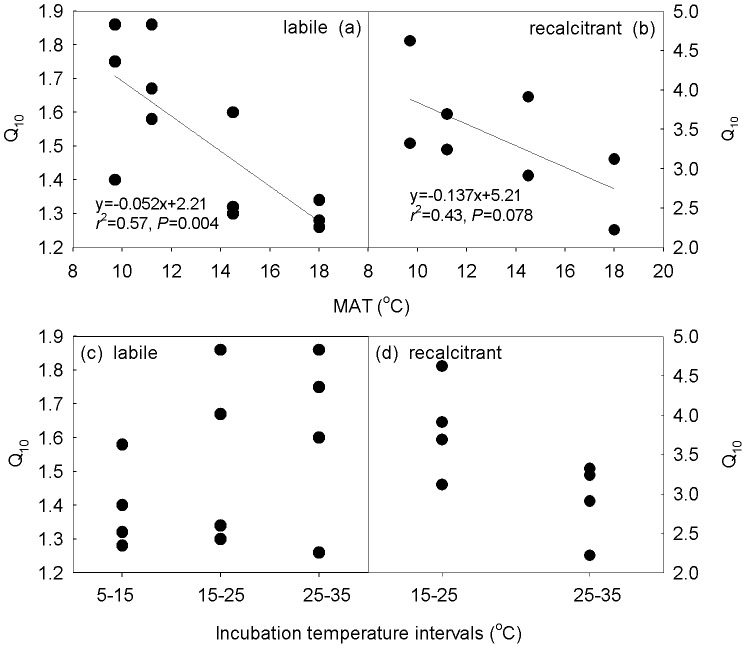
Figure 3. The temperature sensitivity of SOC mineralization for both the labile and the recalcitrant SOC mineralization along the elevation in the four vegetations (a) and at different incubation temperature intervals (b).
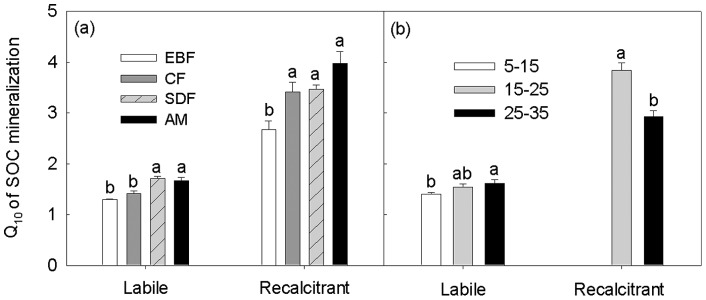
Values are Mean±SE. Different letters stand for significant difference at P<0.05. Asterisks indicate the statistical difference at P<0.01. Missing value in Figure 2C at 5–15°C is because some soils incubated at 5°C did not respire 9% of the total C during the incubation period. LOC: the SOC can be easily decomposed by microorganisms, resulting from the fresh residues such as plant roots and living microbes; ROC: the SOC that is resistant to decay, such as cellulose, humus, and tannin.
Discussion
Comparisons of SOC Mineralization
Climatic conditions are known to affect the accumulation of soil carbon with the highest soil carbon stocks being generated in cold and humid biomes [41]. The altitude, similar to latitude, produces strong gradients in soil carbon stocks [42]. In this study, soil carbon stocks ranked as AM>SDF>CF> EBF (Table 1). The marked spatial differences in temperature and water along elevational gradients in the Wuyi Mountains are probably responsible for the strong observed response of the soil carbon stocks. In general, SOC mineralization followed the similar pattern for all soil samples showed in Figure 1, which was fast during the first 55 days and then slowed down and kept relatively stable in the next 305 days. With increasing incubation time, a decline in SOC mineralization rates was widely observed [19]–[20]. This indicated that the labile C was progressively depleted and the proportion of recalcitrant C became larger. SOC mineralization and the amount of SOC mineralized during incubation increased with increasing incubation temperatures. This is in line with previous studies [19], [37] and a general expectation that warmer temperatures would accelerate the SOC mineralization [43].
With the rising concentration of greenhouse gases in the atmosphere, increases in global temperature are expected to continue and become even more pronounced.
Comparisons of Q 10 at Different Mineralization Levels
We found that the temperature sensitivity of SOC mineralization largely increased with the increased extent of SOC mineralization (Table 2). This is reasonable that as mineralization progressed over time, the contribution of recalcitrant C gradually increased, which has relatively higher sensitivity to temperature changes. Study by Zhu and Cheng [44] also found that Q10 values of SOC decomposition increased with increasing decomposition of SOC, which were estimated using the same method [18], [37]. The differences in the response of SOC mineralization to temperatures found in our study indicated a shift to the decay of biochemically recalcitrant C from labile C. In contrast to our results, a previous study suggests that SOC being mineralized to different extent responds to temperature changes in a similar way based on the averaged Q10 values of the decomposition of intact and root-free soil samples from different layers (0–10, 20–30 cm) [20]. However, the dynamics of SOC decomposition are likely to be quite different between intact and root-free soils originated from different layers with substantially different factors such as substrate availability [1] and physical protection [45], preventing us from directly comparing the results. The limitation is that we did not analyze the microbial community structure during the incubation, which may play a role in influencing the Q10 values. However, changes from labile SOC to recalcitrant SOC were believed to be the dominant factor in regulating the increase in Q10 values [2].
Impact of Elevation and Temperature Intervals on Q10
The temperature sensitivity of SOC mineralization significantly increased along the elevation gradient, both for the labile and the recalcitrant C mineralization (Table 2; Fig. 2A, 2B, Fig. 3A). Previous studies have pointed out that changes in elevation can result in alterations in biological and ecological factors, such as forest type and plant community structure, soil microbes, soil temperature and moisture, precipitation, and nutrients [15], [35], [46], consequently affecting the mineralization of SOC. For example, high Q10 values at high elevations might be related to the microbial community structure that originated from relatively colder temperatures (Table 1) and had higher metabolic efficiency [47]. Though our previous study at the same site [37] found that Q10 values for the labile C did not vary significantly along the elevation, the results of the two studies are not contradictory. First, soil samples were not taken at the same time of each year, one in March, 2006 and the other in late April, 2007 of this study. Second, soil moisture was controlled at different level, 60% vs. 75% (this study). Previous studies showed that soil moisture alone or its interaction with incubation temperatures would influence the rates and Q10 values of SOC mineralization, and would further affect the Q10 values of SOC mineralization [6], [7], [48]. Most importantly, results based on one-way ANOVA showed that Q10 values for the 15–25°C interval of the two studies did not differ significantly from each other (P = 0.10, n = 4).
The temperature sensitivity of SOC mineralization was found to be temperature dependent in the Wuyi Mountains. For example, our results showed that the Q10 values for the labile C mineralization increased from 5–15°C interval to 15–25°C interval (Fig. 3B). Similar results have been reported [26], [49] that calculated Q10 values were higher for the temperature range of 10–20°C than for the 0–10°C°C range. Surprisingly, the Q10 values on average did not decrease at the 25–35°C interval (P>0.05, Fig. 3B) though many studies done earlier indicated that the temperature sensitivity of decomposition decreased with increasing temperatures [3], [50]. It is well known that temperature and moisture are much more important than other factors in affecting the mineralization process of organic matter [51]. In our study, soil moisture was kept at 75% of field capacity but, this value may not be optimal for SOC mineralization at all incubation temperatures. Moreover, the interactive effect of moisture with incubation temperatures would differ among soils [7], [49]. On the other hand, the Q10 values for the recalcitrant C mineralization decreased from 15–25°C interval to 25–35°C interval (Fig. 3B). The different responses of labile and recalcitrant C mineralization to temperatures may be attributable to the changes in the microbial community structures and the physiochemical properties of organic matter themselves being incubated. Additionally, the previous finding by Xu et al. [37] that recalcitrant C was much more sensitive to the changes in temperature at the same study site was further confirmed by this study (Table 2, Fig. 3A). Although several studies found that the temperature sensitivity of the labile C could be higher [16], [17] or similar [20], [21] to that of the recalcitrant C, more and more studies have demonstrated that recalcitrant C is more temperature sensitive [2], [18], [19], [23], [47], in accordance with kinetic theory based on chemical reactions.
These suggest that warmer temperatures may accelerate CO2 effluxes from soil via organic carbon mineralization in the subtropical region because (1) both the labile and recalcitrant C mineralization were sensitive to temperatures; (2) the temperature sensitivity of recalcitrant C mineralization was higher than that of labile C; and (3) most importantly, the temperature sensitivity of labile C mineralization increased with increasing temperature given a higher Q10 value at higher temperature range, 15–25°C, which projected regional temperature would fall into this range [22]. In considering global warming, the role of subtropical forests on the release of soil carbon under rising atmospheric temperature can thus not be ignored.
Acknowledgments
We gratefully acknowledge two anonymous reviewers and the editor for their constructive comments and editing. We also thank Zikun Xu, Xiangen Xu, and Lina Fu for their help with field and lab work.
Funding Statement
This study was supported by the Chinese National Public-warfare Programs (No. 200804006 & No. 201104006) and National Science Foundation of China (31170417). The funders had no role in study design, data collection and analysis, decision to publish, or preparation of the manuscript.
References
- 1. Davidson EA, Janssens IA (2006) Temperature sensitivity of soil carbon decomposition and feedbacks to climate change. Nature 440: 165–173. [DOI] [PubMed] [Google Scholar]
- 2. Craine JM, Fierer N, McLauchlan KK (2010) Widespread coupling between the rate and temperature sensitivity of organic matter decay. Nature Geoscience 3: 854–857. [Google Scholar]
- 3. Kirschbaum MUF (1995) The temperature dependence of soil organic matter decomposition and the effect of global warming on soil organic C storage. Soil Biology and Biochemistry 27: 753–760. [Google Scholar]
- 4. Bekku YS, Nakatsubo T, Kume A, Kume A, Koizumi H (2004) Soil Microbial Biomass, respiration rate, and temperature dependence on a successional glacier foreland in Nylesund, Svalbard. Arctic, Antarctic, and Alpine Research 36(4): 395–399. [Google Scholar]
- 5. Côté L, Brown S, Paré D, Fyles J, Bauhus J (2000) Dynamics of carbon and nitrogen mineralization in relation to stand type, stand age and soil texture in the boreal mixed wood. Soil Biology Biochemistry 32: 1079–1090. [Google Scholar]
- 6. Yuste JC, Baldocchi DD, Gershenson A, Goldstein A, Misson L, et al. (2007) Microbial soil respiration and its dependency on carbon inputs, soil temperature and moisture. Global Change Biology 13: 2018–2035. [Google Scholar]
- 7. Craine JM, Gelderman TM (2010) Soil moisture controls on temperature sensitivity of soil organic carbon decomposition for a mesic grassland. Soil Biology and Biochemistry 43: 455–457. [Google Scholar]
- 8. Lange OL, Green TGA (2005) Lichens show that fungi can acclimate their respiration to seasonal changes in temperature. Oecologia 142: 11–19. [DOI] [PubMed] [Google Scholar]
- 9. Yang GR, Zhang WJ, Tong CL, Wu JS (2005) Effects of temperature on the mineralization of organic carbon in sediment of wetland. Acta Ecologica Sinica 25(2): 243–248 (in Chinese).. [Google Scholar]
- 10. Schimel DS, Braswell BH, Holland EA, McKeown R, Ojima DS, et al. (1994) Climate edaphic and biotic controls over storage and turnover of carbon in soils. Global Biogeochemistry Cycles 8: 279–293. [Google Scholar]
- 11. Kirschbaum MUF (2000) Will changes in soil organic carbon act as a positive or negative feedback on global warming? Biogeochemistry 48(1): 21–51. [Google Scholar]
- 12. Jenkinson DS, Adams DE, Wild A (1991) Model estimates of CO2 emissions from soil in response to global warming. Nature 351: 304–306. [Google Scholar]
- 13. Bottner P, Coûtea ux MM, Anderson JM, Berg B, Billés G, et al. (2000) Decomposition of 13C labeled plant material in a European 65–40° latitudinal transect of coniferous forest soils: simulation of climate change by translocation of soils. Soil Biology and Biochemistrt 32: 527–543. [Google Scholar]
- 14. Townsend AR, Vitousek PM, Desmarais DJ, Tharpe A (1997) Soil carbon pool structure and temperature sensitivity inferred using CO2 and CO2 incubation fluxes from five Hawaiian soils. Biogeochemistry 38: 1–17. [Google Scholar]
- 15. Trumbore SE, Davidson EA, Barbosa DE, Camargo P, Nepstad DC, et al. (1995) Below ground cycling of carbon in forests and pastures of eastern Amazonia. Global Biogeochemical Cycles 9: 515–528. [Google Scholar]
- 16. Giardina CP, Ryan MG (2000) Evidence that decomposition rates of organic carbon in mineral soil do not vary with temperature. Nature 404: 858–861. [DOI] [PubMed] [Google Scholar]
- 17. Reichstein M, Subke JA, Angeli AC, Tenhunen JD (2005) Does the temperature sensitivity of decomposition of soil organic matter depend upon water content, soil horizon, or incubation time? Global Change Biology 11: 1754–1767. [Google Scholar]
- 18. Conant RT, Steinweg JM, Haddix ML, Paul EA, Plante AF, et al. (2008) Experimental warming shows that decomposition temperature sensitivity increases with soil organic matter recalcitrance. Ecology 89: 2384–2391. [DOI] [PubMed] [Google Scholar]
- 19. Wetterstedt JAM, Persson T, Agren GI (2009) Temperature sensitivity and substrate quality in soil organic matter decomposition: results of an incubation study with three substrates. Global Change Biology 16: 1806–1819. [Google Scholar]
- 20. Fang C, Smith P, Moncrieff JB, Smith JU (2005) Similar response of labile and resistant soil organic matter pools to changes in temperature. Nature 433: 57–59. [DOI] [PubMed] [Google Scholar]
- 21. Conen F, Leifeld J, Seth B, Alewell C (2006) Warming mineralizes young and old soil carbon equally. Biogeosciences 3: 515–519. [Google Scholar]
- 22.Allison I, Bindoff NL, Bindoff RA, Coc PM, de Noblet N, et al.. (2009) The Copenhagen Diagnosis, 2009: Updating the World on the Latest Climate Science. The University of New South Wales Climate Change Research Centre (CCRC), Sydney, Australia.
- 23. Xu X, Niu S, Sherry RA, Zhou X, Zhou J, et al. (2012) Interannual variability in responses of belowground net primary productivity (NPP) and NPP partitioning to long-term warming and clipping in a tallgrass prairie. Global Change Biology 18: 1648–1656. [Google Scholar]
- 24.Kirschabum MUF (2006) The temperature dependence of organic matter decomposition-still a topic of debate. Soil Biology and Biochemistry, 38, 2510–2518.
- 25. Kätterer T, Reichstein M, Andren O, Lomander A (1998) Temperature dependence of organic matter decomposition: a critical review using literature data analyzed with different models. Biology and Fertility of Soils 27: 258–262. [Google Scholar]
- 26. Niklińska M, Klimek B (2007) Effect of temperature on the respiration rate of forest soil organic layer along an elevation gradient in the Polish Carpathians. Biology and Fertility of Soils 43: 511–518. [Google Scholar]
- 27. Mikan CJ, Schimel JP, Doyle AP (2002) Temperature controls of microbial respiration in arctic tundra soils above and below freezing. Soil Biology and Biochemistry 34: 1785–1795. [Google Scholar]
- 28. Bekku YS, Nakatsubo T, Kume A, Adachi M, Koizumi H (2003) Effect of warming on the temperature dependence of soil respiration rate in arctic, temperature and tropical soils. Applied Soil Ecology 22: 205–210. [Google Scholar]
- 29. Li J, Ziegler S, Lane CS, Billings SA (2012) Warming-enhanced preferential microbial mineralization of humified boreal forest soil organic matter: Interpretation of soil profiles along a climate transect using laboratory incubations. J. Geophys. Res. 117: G02008. [Google Scholar]
- 30. Smith JL, Halvorson JJ, Bolton HJ (2002) Soil properties and microbial activity across a 500 m elevation gradient in a semiarid environment. Soil Biology and Biochemistry 34: 1749–1757. [Google Scholar]
- 31. Reynolds BC, Hunter MD (2001) Responses of soil respiration, soil nutrients, and litter decomposition to inputs from canopy herbivores. Soil Biology and Biochemistry 33: 1641–1652. [Google Scholar]
- 32. Hunter MD, Linnen CR, Reynolds BC (2003) Effects of endemic densities of canopy herbivores on nutrient dynamics along a gradient in elevation in the southern Appalachians. Pedobiologia 47: 231–244. [Google Scholar]
- 33. Simmons JA, Fernandez IJ, Briggs RD, Delaney MT (1996) Forest floor carbon pools and fluxes along a regional climate gradient in Maine, USA. Forest Ecology and Management 84: 81–95. [Google Scholar]
- 34. Trumbore SE (1997) Potential responses of soil organic carbon to global environmental change. Proceedings of the National Academy of Science USA 94: 8284–8291. [DOI] [PMC free article] [PubMed] [Google Scholar]
- 35. Garten CT Jr, Post WM, Hanson PJ, Cooper LW (1999) Forest soil carbon inventories and dynamics along an elevation gradient in the southern Appalachian Mountains. Biogeochemistry 45: 115–145. [Google Scholar]
- 36. Hyvonen R, Matti PB, Agren GI (2002) Modelling carbon dynamics in coniferous forest soils in a temperature gradient. Plant and Soil 242: 33–39. [Google Scholar]
- 37. Xu X, Zhou Y, Ruan HH, Luo YQ, Wang JS (2010) Temperature sensitivity increases with soil organic carbon recalcitrance along an elevational gradient in the Wuyi Mountains, China. Soil Biology and Biochemistry 42: 1811–1815. [Google Scholar]
- 38.He JY, Lan SR, Liu CD, Li LH (1994) Wuyishan research series. Xiamen University Press.
- 39. Zheng CY, Fang JY (2004) Changes in air temperature variables along altitudinal gradient in Mt. Hunggang, China. Acta Meteorologica Sinica 62: 251–256 (in Chinese).. [Google Scholar]
- 40. De Neve S, Hofman G (2000) Influence of soil compaction on carbon and nitrogen mineralization of soil organic matter and crop residues. Biology and Fertility of Soil 30: 544–549. [Google Scholar]
- 41. Post WM, Emanuel WR, Zinke PJ, Stangenberger AG (1982) Soil carbon pools and world life zones. Nature 298: 156–159. [Google Scholar]
- 42. Rodeghiero M, Cescattu A (2005) Main determinants of forest soil respiration along an elevation/temperature gradient in the Italian Alps. Global Change Biology 11: 1024–1041. [Google Scholar]
- 43. Davidson EA, Trumbore SE, Amundson R (2000) Soil warming and organic carbon content. Nature 408: 789–790. [DOI] [PubMed] [Google Scholar]
- 44. Zhu B, Cheng WX (2011) Constant and diurnally-varying temperature regimes lead to different temperature sensitivities of soil organic carbon decomposition. Soil Biology and Biochemistry 43: 866–869. [Google Scholar]
- 45. Six J, Feller C, Denef K, Ogle SM, Sa JCD, et al. (2002) Soil organic matter, biota and affregation in temperate and tropical soils-effect of no-tillage. Agronomie 22: 755–775. [Google Scholar]
- 46. Silver WL (1998) The potential effects of elevated CO2 and climate change on tropical forest soils and biogeochemical cycling. Climate Change 39: 337–361. [Google Scholar]
- 47. Fierer N, Craine JM, McLaughlan K, Schimel J (2005) Litter quality and the temperature sensitivity of decomposition. Ecology 86: 320–326. [Google Scholar]
- 48. Rey A, Petsikos C, Jarvis PG, Grace J (2005) Effect of temperature and moisture on rates of carbon mineralization in a Mediterranean oak forest soil under controlled and field conditions. European Journal of Soil Science 56: 589–599. [Google Scholar]
- 49. Howard DM, Howard PJA (1993) Relationship between CO2 evolution, moisture content and temperature for a range of soil types. Soil Biology and Biochemistry 25: 1537–1547. [Google Scholar]
- 50. Niklińska M, Maryański M, Laskowski R (1999) Effect of temperature on humus respiration rate and nitrogen mineralization: implications for global climate change. Biogeochemistry 44: 239–257. [Google Scholar]
- 51. Wardle DA, Nilsson MC, Zackrisson O, Gallet C (2003) Determinants of litter mixing effect in a Swedish boreal forest. Soil Biology and Biochemistry 35: 827–835. [Google Scholar]