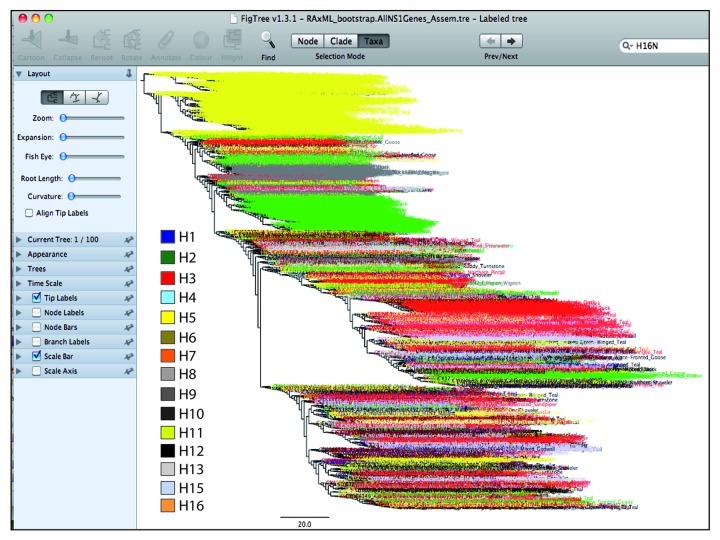
Figure 5. An overview of the tree annotated in FigTree. The clustering pattern of different subtypes of influenza viruses is highlighted with different colors. The subtypes such as H3, H5 and H6 made a bigger cluster owing to same genetic nature. All other subtypes had shown diffused pattern within the tree. For clarification purposes, only a tree of the avian influenza NS1 gene is displayed.
