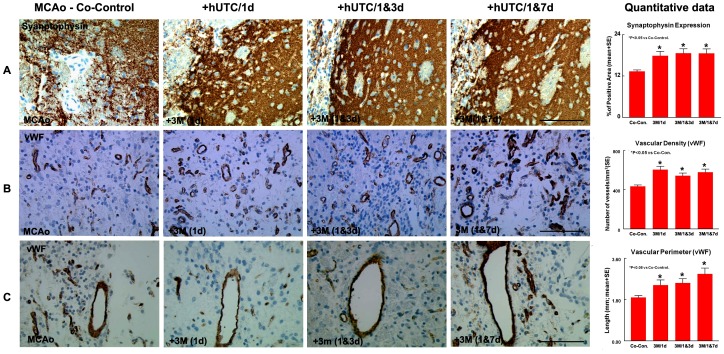
Figure 2. hUTC treatment effect on vascular density, perimeter and synaptophysin expression.

Panel A shows significant increase in Synaptophysin expression in the IBZ in all hUTC treatment groups compared to the co-control group. Panels B–C show significant increase in vascular density and perimeter in the IBZ in all hUTC treatment groups compared to the co-control group. *p<0.05 vs Co-control. SE = standard error. Scale bar in A,B and C = 100µm.
