
Figure 1. Maternal weight gain, food consumption, adiposity and liver weight in response to chronic phase shifts.
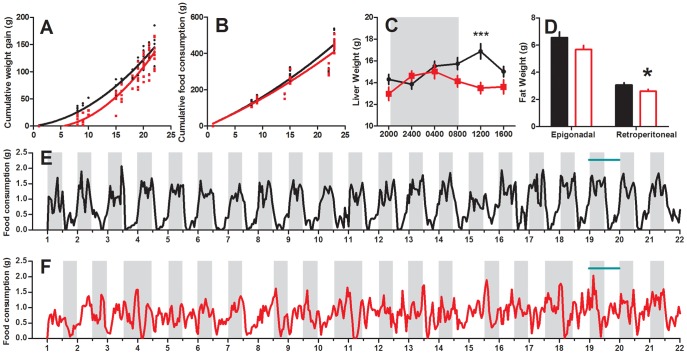
Weight gain (a), total food consumption (b) day 20 liver (c) and epigonadal/retroperitoneal fat weight (d) of rats exposed to chronic phase shifts (CPS, red) or normal lighting conditions (control, black) throughout gestation, *P<0.05, ***P<0.001. The timing of food consumption throughout gestation in control (e) and CPS (f) dams. Horizontal green bar represents the period of tissue collection, and shading the timing of darkness in each group.