
Figure 2. Litter size, fetal weight and placental weight in response to chronic phase shifts.
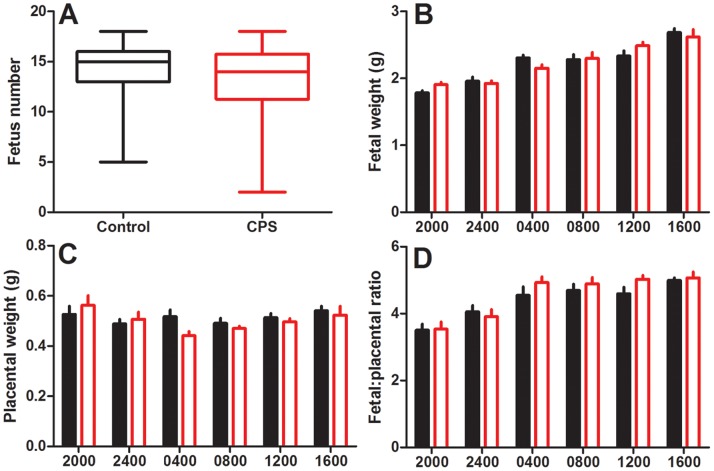
Litter size (a), fetal weight (b), placental weight (c) and the fetal:placental ratio (d) of rats exposed to chronic phase shifts (CPS, red) or normal lighting conditions (control, black) throughout gestation. Fetus number is expressed using a box plot with the median, minimum and maximum values (whiskers) and the inter-quartile range (n = 32 per treatment). Fetal and placental weight and ratio are 2 representative fetuses/placenta from each litter, corresponding to position L2 and R2, mean ± SEM, n = 8–12 per group.