
Figure 6. Circadian profile of metabolic gene expression in maternal liver.
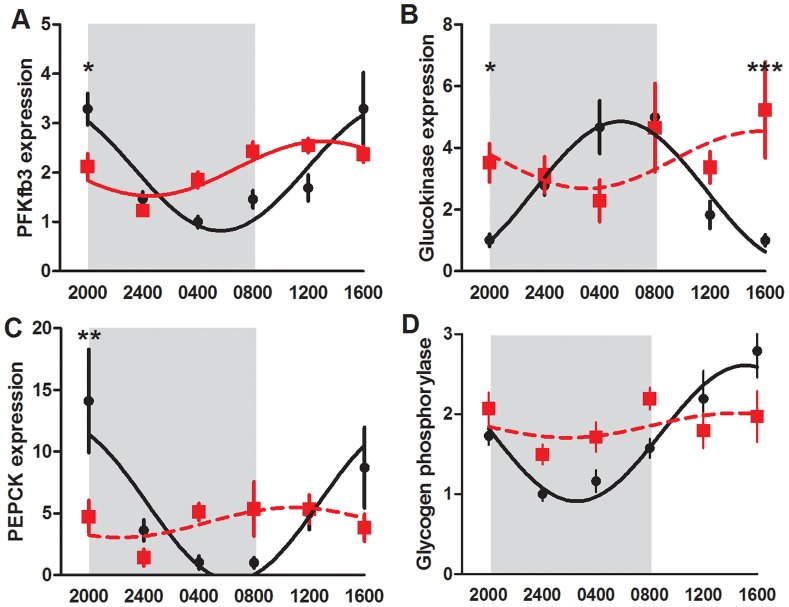
PFKfb3 (a), glucokinase (b), PEPCK (c) and glycogen phosphorylase (d) mRNA expression in the maternal liver of control (black circle) and CPS (red square) dams at day 20 of gestation, 1 day after resumption of the normal photoperiod. Shading represents the time of darkness in both groups. Data has been fit to sine curve with the period constrained to 1, with solid lines representing a significant fit and dashed lines a non-significant fit. Data is mean ± SEM, n = 4–6 per treatment group per time point, *P<0.05, **P<0.01, ***P<0.001.