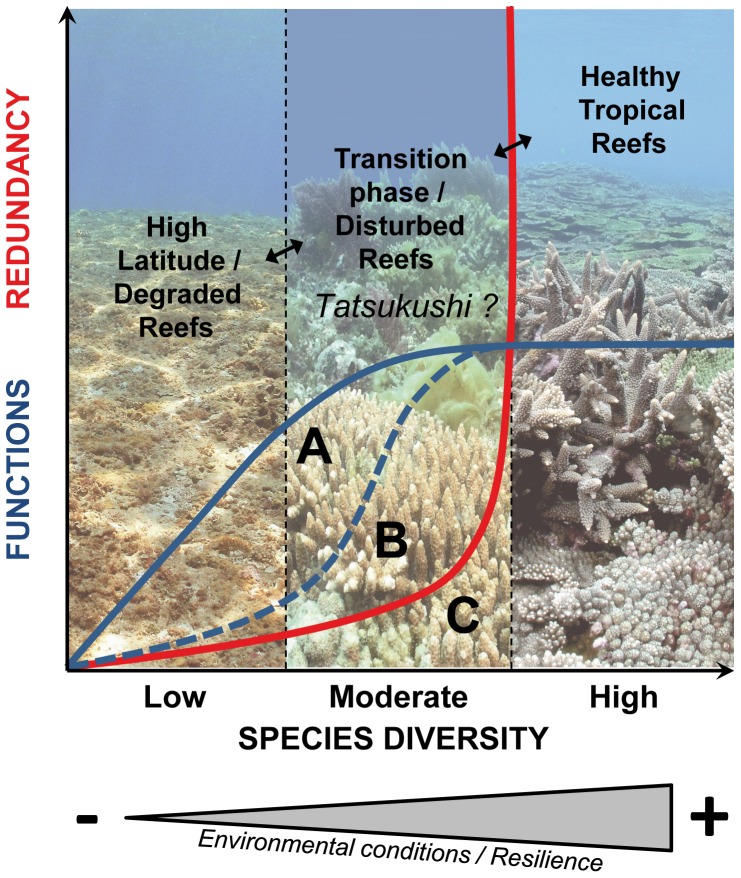
Figure 5. Relationship between the diversity and functional diversity (A and B)/redundancy (C): schematic scenarios (modified from [61] and [62]).

A: Functional diversity increases at declining rates with increased species diversity, which reaches an asymptote at high diversity levels; B: high functional redundancy at low species diversity followed by a rapid increase at an intermediate species diversity, until functional diversity asymptotes at high diversity levels [49]. Photo credits: CM Hsu.
