
Figure 1. Phylogenomic tree and heatmap analyses of the genus Corynebacterium.
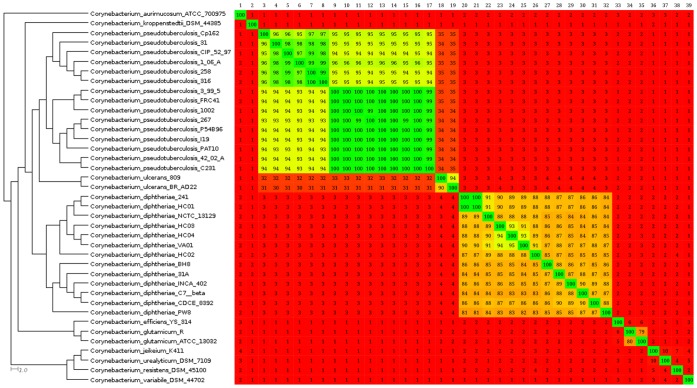
All the complete genomes from the genus Corynebacterium were retrieved from the NCBI ftp site. Comparisons between the variable content of all the strains were plotted as percentages of similarity on the heatmap using Gegenees (version 1.1.4). The percentage of similarity was used to generate a phylogenomic tree with SplitsTree (version 4.12.6). Numbers from 1 to 39 (upper-left to upper-right corner) represent species from Corynebacterium aurimucosum ATCC 70097 to Corynebacterium variable DSM 44702 (upper-left to lower-left corner). Percentages were plotted with a spectrum ranging from red (low similarity) to green (high similarity). On the heatmap, the upper portion is not symmetrical to the lower portion because the variable contents of all genomes present different sizes. Therefore, considering a scenario where the variable content from genomes A and B are composed of 100 and 80 genes, respectively, with a common repertoire of 40 genes, genome A will present 40% of similarity to genome B and genome B will present 50% of similarity to genome A.