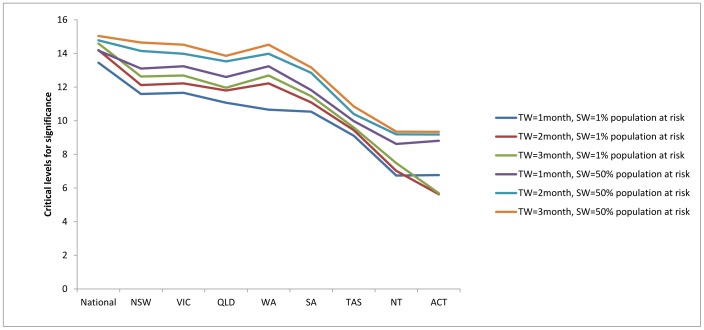
Figure 5. Critical levels for cluster significance (p<0.05) by national and state cluster detection.

Remark: TW = Maximum temporal window size; SW = Maximum spatial window size.

Remark: TW = Maximum temporal window size; SW = Maximum spatial window size.