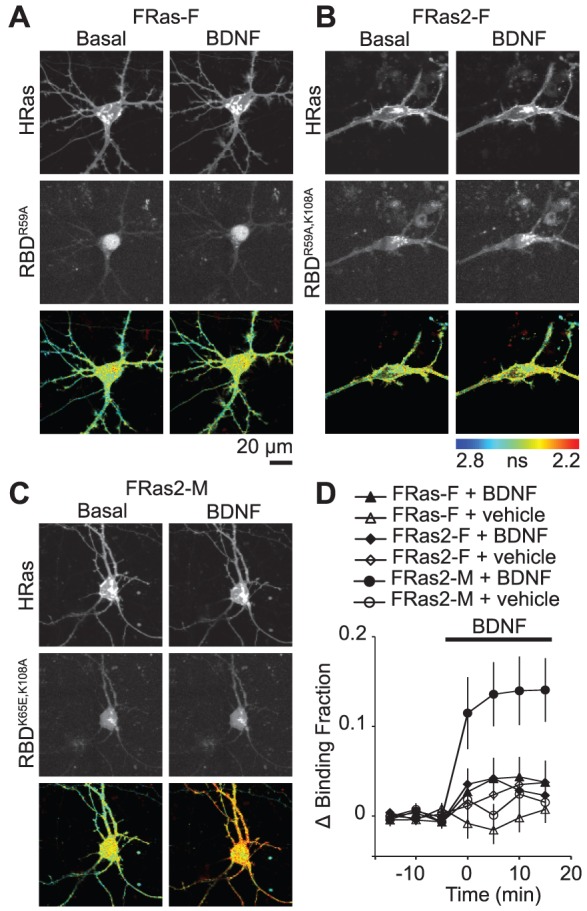
Figure 3. Distribution and characterization of FRET sensors for Ras activation in cortical neurons.

(A–C) Representative 2-photon fluorescence images of donor (mEGFP-Ras: top panel) and acceptor (mRFP-RBD-mRFP: middle panel) and fluorescence lifetime images (bottom panel) of FRas-F (A), FRas2-F (B) and FRas2-M (C) in cortical neurons. mRFP images are dim because of the non-optimal excitation wavelength for mRFP (920 nm). (D) Change in the fraction of donor (mEGFP-Ras) bound to acceptor (mRFP-RBD-mRFP) in response to application of BDNF (100 ng/ml). Error bars indicate s.e.m. over 4–11 cells from 3 preparations.
