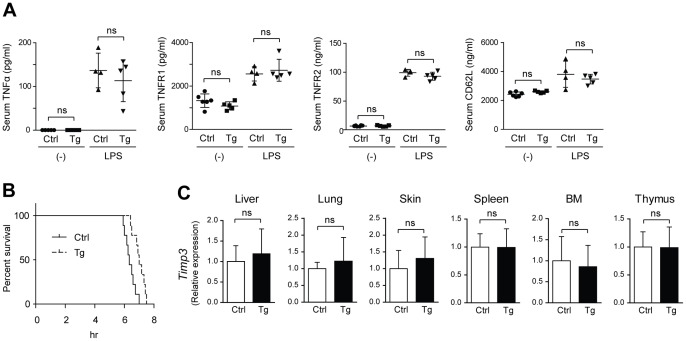
Figure 3. No apparent change in the serum levels of TACE substrates was observed in Tace-Tg mice.

(A) The serum levels of TNFα, TNFR1, TNFR2, and CD62L were analyzed by ELISA in control and Tace-Tg (Tg) mice. The sera were collected under unchallenged conditions (−) or 3 h after the intraperitoneal injection of LPS and D-galactosamine. (B) Survival curve of the control (Ctrl) and Tace-Tg (Tg) mice treated with LPS and D-galactosamine (n = 18). (C) Quantitative RT-PCR of Timp3 in the liver, lung, skin, spleen, bone marrow cells (BM), and thymus collected from the control (Ctrl) and Tace-Tg mice. Bars, S.D. ns, not significant.
