
Figure 2. Example distance diagram, showing the four different areas of interest.
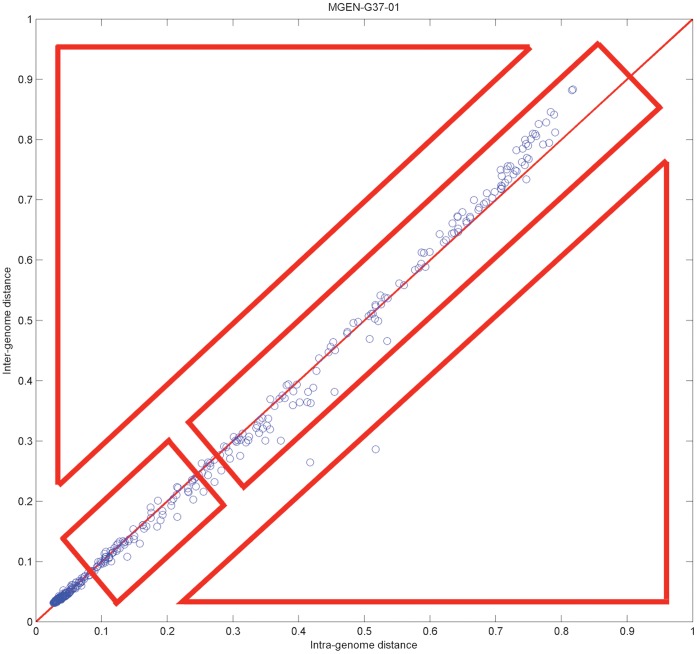
The specific diagram is derived from M. genitalium as described, using the following parameters: no discretization process (both on fuzzy genome profiles and de-noized phylogenetic profile data – therefore, parameter alpha is not applicable); SVD threshold λ = 0.75; distance measure: cosine (default choice for real-value vectors). Evidently, most genes in this case are found close to the main diagonal; this might not be the case for other species.