
Figure 6. Distance diagrams of the 5 reference species.
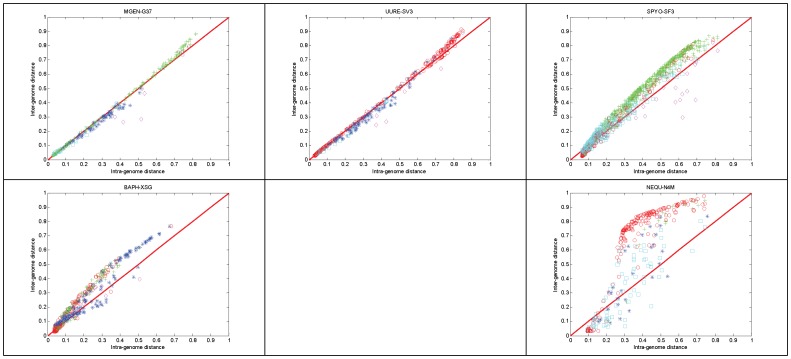
The upper-left panel representing M. genitalium is identical to Figure 2 , except the color-coding scheme. This scheme encodes the genome profile of the species that produced the minimum inter-genome distance, as in Figure 1 . Parameter settings as in Figure 2 .