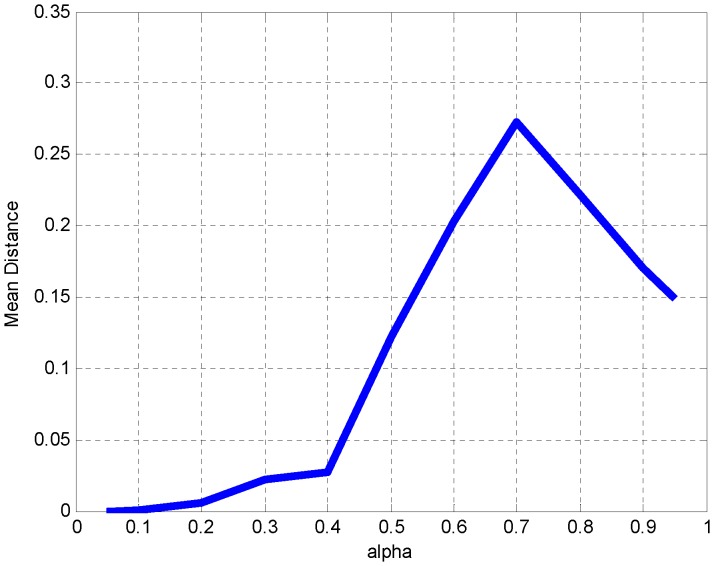
Figure 11. Parameter optimization for threshold α.

By keeping parameters distance metric (Jaccard) and SVD threshold λ (0.75) constant, α is set to different values (x-axis). Distance distributions for all genes are derived from the main diagonal and within the distance diagram; mean distance is shown (y-axis). It is evident that there is an inflection point at α = 0.4 beyond which distances become sharply larger, thus indicating a higher disparity of gene profiles and a divergence from the expected presence of their corresponding coordinates along the main diagonal. This value can be taken as a maximal optimum value. Aiming at the most flexible value of α, without losing the on-diagonal presence of genes, an optimum range is between 0.3 and 0.4, hence the selection of 0.35 as our default α value.
