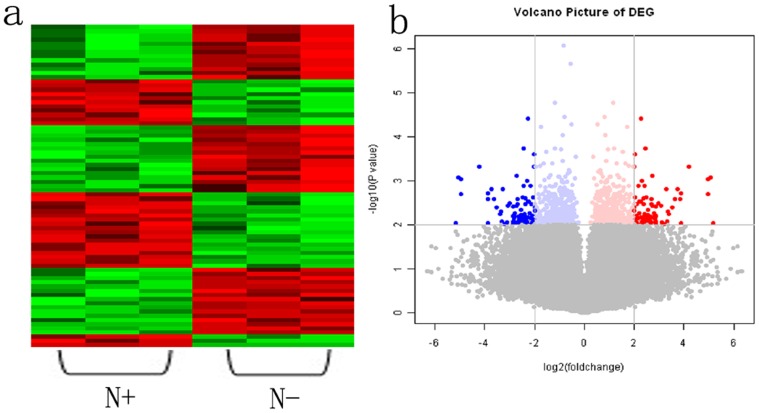
Figure 1. Gene expression profiling analysis of differential expression genes in ESCC with and without LN metastasis.

Red color represents the up-regulated genes, and green or blue color represents the down-regulated genes in ESCC with LN metastasis. a, Hierarchical clustering analysis of genes associated with LN metastasis, N+, positive lymph node metastasis; N-, negative lymph node metastasis. b, Volcano plot analysis of differential expressed genes in ESCC between with and without LN metastasis. The x axis represents the differential expression profiles with the fold-induction ratios in a log2 scale, and the y axis represents the P value of T-test in a log10 scale.
