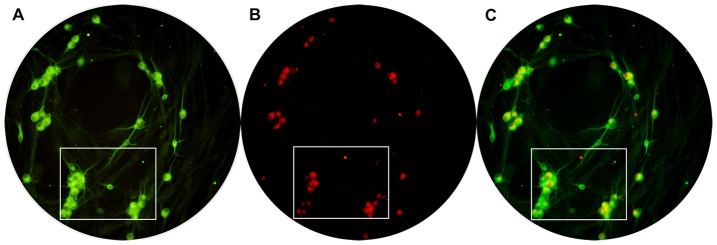
Figure 4. The example images to show how to count cells.

The full visual field showed in the circle in which neurons were counted in one sample. The neurons in the box were showed in figure 6. Panel A is the total neurons (MAP-2-IR neurons). Panel B is NF-200-IR neurons. Panel C is the overlay of Panel A and B.
