
Figure 7. Double fluorescent labeling of MAP-2 and GAP-43.
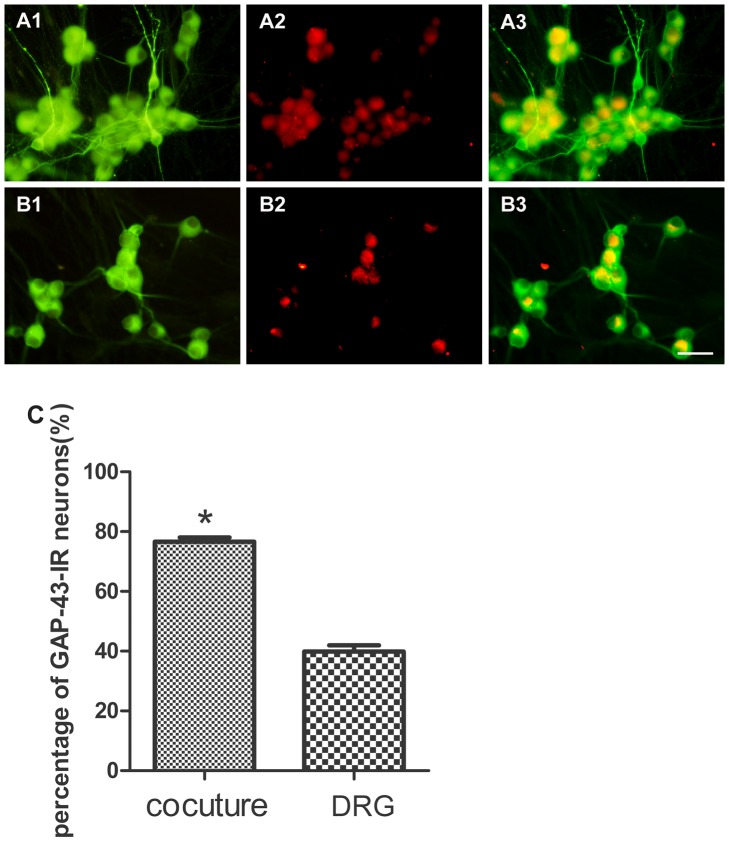
Panel A: neuromuscular coculture (A1: MAP-2; A2: GAP-43; A3: overlay of A1 and A2). Panel B: DRG explant culture (B1: MAP-2; B2: GAP-43; B3: overlay of B1 and B2). Panel C: The percentage of migrating GAP-43-IR neurons. The percentage of GAP-43-IR neurons increased in neuromuscular coculture as compared with that in DRG explants culture alone. Bar graphs with error bars represent mean ± SEM (n = 18 different samples), Scale bar = 50 µm. *P<0.001.