
Figure 9. The protein levels of NF-200.
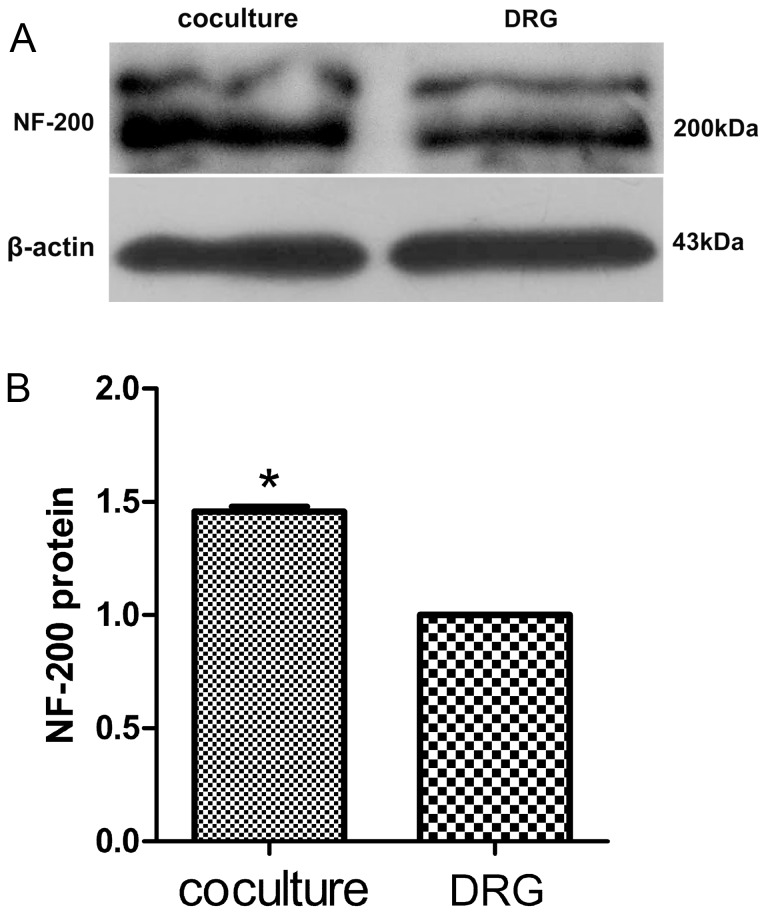
The protein levels of NF-200 increased in neuromuscular coculture as compared with that in DRG explants culture alone. Bar graphs with error bars represent mean ± SEM (n = 6). *P<0.001.
Official websites use .gov
A
.gov website belongs to an official
government organization in the United States.
Secure .gov websites use HTTPS
A lock (
) or https:// means you've safely
connected to the .gov website. Share sensitive
information only on official, secure websites.
The protein levels of NF-200 increased in neuromuscular coculture as compared with that in DRG explants culture alone. Bar graphs with error bars represent mean ± SEM (n = 6). *P<0.001.