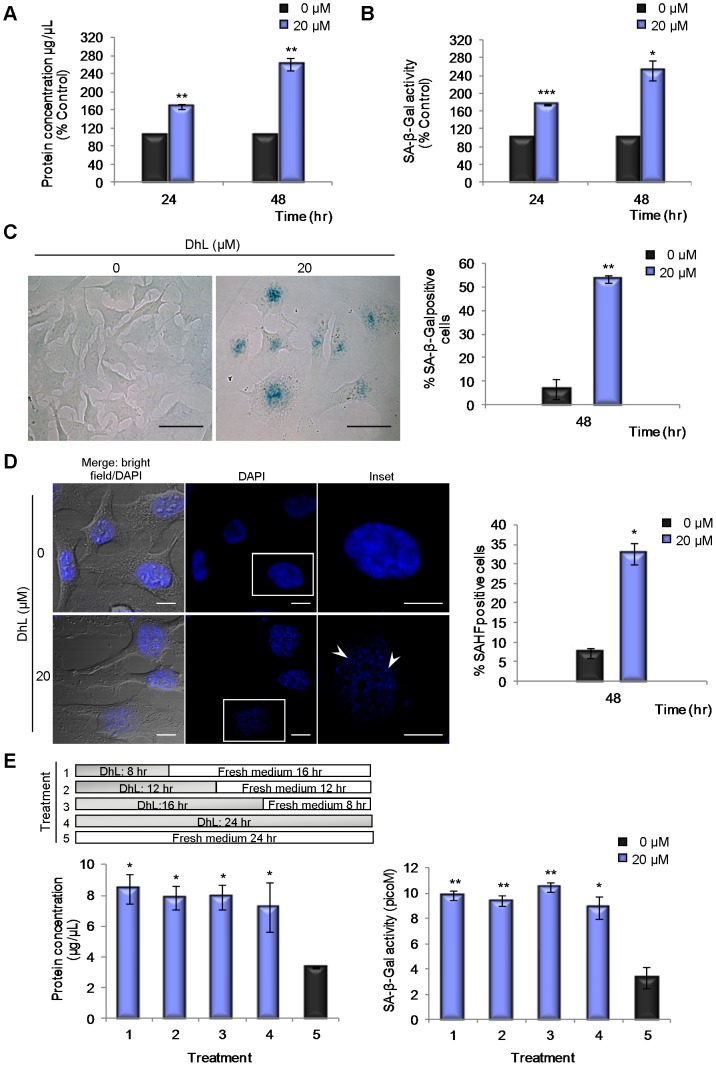
Figure 7. DhL induces cellular senescence in HeLa cells.

Synchronized HeLa cells treated with 0–20 µM DhL for 48 h were analyzed for: (A) protein concentration and (B) SA-β-Gal activity (at pH 6) in cell extracts. Equal volumes of supernatants were assayed. C) SA-β-Gal activity at pH 6 in situ. Representative panels for control and treated cells stained for SA-β-Gal and examined by bright field microscopy are shown. Bar: 50 µm. Right: percentages of SA-β-Gal-positive cells. (D) Senescence-associated heterochromatin foci (SAHF) in control and treated cells stained with DAPI and examined by bright field and fluorescence microscopy (merge: bright field/DAPI) and fluorescence microscopy (DAPI). The insets are magnifications of the boxed areas in the DAPI column. Arrowheads indicate the SAHF. Bar: 10 µm. Right: percentages of SAHF-positive cells. (E) Synchronized HeLa cells treated with 20 µM DhL and then with fresh medium plus DMSO (“Fresh medium”) for the time indicated in the upper panel (treatment 1–4) or with fresh medium for 24 h (treatment 5) were analyzed for protein concentration and for SA-β-Gal activity at pH 6. The protein concentration (lower left) and SA-β-Gal activity (lower right) in cell extracts from each treatment are shown. Equal volumes of extract were assayed. Data represents the mean ± SEM of 2 experiments. * p≤0.05, ** p≤0.01, *** p≤0.001 vs. control group (0 µM).
